Evaluating Model Performance
Here I’ll discuss splitting the data for training and testing, the performance metric I chose, the algorithm used for the modeling and how the hyper-parameters for the model were chosen.
Splitting the Data
First a function named shuffle_split_data was created that acts as an alias for the train_test_split function from sklearn. The main difference is that the ordering of the data-sets is changed from both x’s followed by both y’s to both training sets followed by both testing sets. In this case a 70% training data, 30% test data split was used.
We split the data into training and testing subsets so that we can assess the model using a different data-set than what it was trained on, thus reducing the likelihood of overfitting the model to the training data and increasing the likelihood that it will generalize to other data.
Choosing a Performance Metric
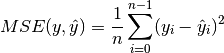
There are several possible regression metrics to use, but I chose Mean Squared Error as the most appropriate performance metric for predicting housing prices because we are predicting a numeric value (a regression problem) and while Mean Absolute Error, Median Absolute Error, Explained Variance Score, or r2_score could also be used, I wanted a metric that would be based on the errors in the model and the MSE emphasizes larger errors more and so I felt it would be preferable.
The Mean Squared Error is an average of the squared differences between predicted values and the actual values.
DecisionTreeRegressor
The model was built using sklearn’s DecisionTreeRegressor, a non-parametric, tree-based algorithm (using the Classification and Regression Trees (CART) tree algorithm).
Grid Search
A grid search was used to find the optimal parameters (tree depth) for the DecisionTreeRegressor. The GridSearchCV algorithm exhaustively works through the parameters it is given to find the parameters that create the best model using cross-validation. Because it is exhaustive it is appropriate when the model-creation is not excessively computationally intensive, otherwise its run-time might be infeasible.
Cross-Validation
As mentioned, GridSearchCV uses cross-validation to find the optimal parameters for a model. Cross-validation is a method of testing a model by partitioning the data into subsets, with each subset taking a turn as the test set while the data not being used as a test-set is used as the training set. This allows the model to be tested against all the data-points, rather than having some data reserved exclusively as training data and the remainder exclusively as testing data.
Because grid-search attempts to find the optimal parameters for a model, it’s advantageous to use the same training and testing data in each case (case meaning a particular permutation of the parameters) so that the comparisons are equitable. One could simply perform an initial train-validation-test split and use this throughout the grid search, but this then risks the possibility that there was something in the initial split that will bias the outcome. By using all the partitions of the data as both test and training data, as cross-validation does, the chance of a bias in the splitting is reduced and at the same time all the parameter permutations are given the same data to be tested against.
In this case I used k=10 for the k-fold cross validation that the GridSearchCV uses.