Predicting Cancer (Course 3, Assignment 1)
This assignment uses the Breast Cancer Wisconsin (Diagnostic) Database to create a classifier that can help diagnose patients.
The data
cancer = load_breast_cancer()
This data set has 569 rows (cases) with 30 numeric features. The outcomes are either 1 - malignant, or 0 - benign.
From their description:
Features are computed from a digitized image of a fine needle aspirate (FNA) of a breast mass. They describe characteristics of the cell nuclei present in the image.
The object returned by load_breast_cancer() is a scikit-learn Bunch object, which is similar to a dictionary, but like pandas, also supports using dot-notation to retrieve attributes when possible (i.e. no spaces in the keys).
print(cancer.keys())
dict_keys(['DESCR', 'target', 'feature_names', 'data', 'target_names'])
Question 0 (Example)
How many features does the breast cancer dataset have?
def answer_zero():
    """number of feature names in the data

    Returns:
     int: count of feature names in the 'cancer' data-set
    """
    return len(cancer['feature_names'])
answer_zero()
30
Question 1
Scikit-learn works with lists, numpy arrays, scipy-sparse matrices, and pandas DataFrames, so converting the dataset to a DataFrame is not necessary for training this model. Using a DataFrame does however help make many things easier such as munging data, so let's practice creating a classifier with a pandas DataFrame.
def answer_one():
    """converts the sklearn 'cancer' bunch

    Returns:
     pandas.DataFrame: cancer data
    """
    data = numpy.c_[cancer.data, cancer.target]
    columns = numpy.append(cancer.feature_names, ["target"])
    return pandas.DataFrame(data, columns=columns)
frame = answer_one()
assert frame.shape == (len(cancer.target), 31)
Question 2
What is the class distribution? (i.e. how many instances of malignant and how many benign?)
def answer_two():
    """calculates number of malignent and benign

    Returns:
     pandas.Series: counts of each
    """
    cancerdf = answer_one()
    counts = cancerdf.target.value_counts(ascending=True)
    counts.index = "malignant benign".split()
    return counts
output = answer_two()
assert output.malignant == 212
assert output.benign == 357
Question 3
Split the DataFrame into `X` (the data) and `y` (the labels).
def answer_three():
    """splits the data into data and labels

    Returns:
     (pandas.DataFrame, pandas.Series): data, labels
    """
    cancerdf = answer_one()
    X = cancerdf[cancerdf.columns[:-1]]
    y = cancerdf.target
    return X, y
x, y = answer_three()
assert x.shape == (569, 30)
assert y.shape == (569,)
Question 4
Using train_test_split(), split X and y into training and test sets (X_train, X_test, y_train, and y_test).
from sklearn.model_selection import train_test_split

def answer_four():
    """splits data into training and testing sets

    Returns:
     tuple(pandas.DataFrame): x_train, y_train, x_test, y_test
    """
    X, y = answer_three()
    return train_test_split(X, y, train_size=426, test_size=143, random_state=0)
x_train, x_test, y_train, y_test = answer_four()
assert x_train.shape == (426, 30)
assert x_test.shape == (143, 30)
assert y_train.shape == (426,)
assert y_test.shape == (143,)
Question 5
Using KNeighborsClassifier, fit a k-nearest neighbors (knn) classifier with X_train, y_train and using one nearest neighbor (n_neighbors = 1).
from sklearn.neighbors import KNeighborsClassifier

def answer_five():
    """Fits a KNN-1 model to the data

    Returns:
     sklearn.neighbors.KNeighborsClassifier: trained data
    """
    X_train, X_test, y_train, y_test = answer_four()
    model = KNeighborsClassifier(n_neighbors=1)
    model.fit(X_train, y_train)
    return model
knn = answer_five()
assert type(knn) == KNeighborsClassifier
assert knn.n_neighbors == 1
Question 6
Using your knn classifier, predict the class label using the mean value for each feature.
You can use cancerdf.mean()[:-1].values.reshape(1, -1) which gets the mean value for each feature, ignores the target column, and reshapes the data from 1 dimension to 2 (necessary for the predict method of KNeighborsClassifier).
def answer_six():
    """Predicts the class labels for the means of all features

    Returns:
     numpy.array: prediction (0 or 1)
    """
    cancerdf = answer_one()
    means = cancerdf.mean()[:-1].values.reshape(1, -1)
    model = answer_five()
    return model.predict(means)
answer_six()
array([ 1.])
Question 7
Using your knn classifier, predict the class labels for the test set X_test.
def answer_seven():
    """predicts likelihood of cancer for test set

    Returns:
     numpy.array: vector of predictions
    """
    X_train, X_test, y_train, y_test = answer_four()
    knn = answer_five()
    return knn.predict(X_test)
predictions = answer_seven()
assert predictions.shape == (143,)
assert set(predictions) == {0.0, 1.0}
print("no cancer: {0}".format(len(predictions[predictions==0])))
print("cancer: {0}".format(len(predictions[predictions==1])))
Question 8
Find the score (mean accuracy) of your knn classifier using X_test and y_test.
def answer_eight():
    """calculates the mean accuracy of the KNN model

    Returns:
     float: mean accuracy of the model predicting cancer
    """
    X_train, X_test, y_train, y_test = answer_four()
    knn = answer_five()
    return knn.score(X_test, y_test)
answer_eight()
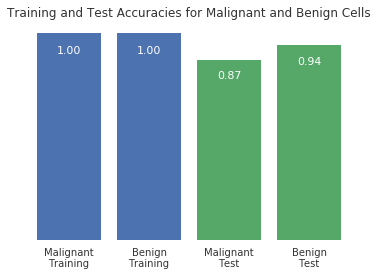
Optional plot
Try using the plotting function below to visualize the differet predicition scores between training and test sets, as well as malignant and benign cells.
%matplotlib inline

def accuracy_plot():
    import matplotlib.pyplot as plt

    X_train, X_test, y_train, y_test = answer_four()

    # Find the training and testing accuracies by target value (i.e. malignant, benign)
    mal_train_X = X_train[y_train==0]
    mal_train_y = y_train[y_train==0]
    ben_train_X = X_train[y_train==1]
    ben_train_y = y_train[y_train==1]

    mal_test_X = X_test[y_test==0]
    mal_test_y = y_test[y_test==0]
    ben_test_X = X_test[y_test==1]
    ben_test_y = y_test[y_test==1]

    knn = answer_five()

    scores = [knn.score(mal_train_X, mal_train_y), knn.score(ben_train_X, ben_train_y),
              knn.score(mal_test_X, mal_test_y), knn.score(ben_test_X, ben_test_y)]


    plt.figure()

    # Plot the scores as a bar chart
    bars = plt.bar(numpy.arange(4), scores, color=['#4c72b0','#4c72b0','#55a868','#55a868'])

    # directly label the score onto the bars
    for bar in bars:
        height = bar.get_height()
        plt.gca().text(bar.get_x() + bar.get_width()/2, height*.90, '{0:.{1}f}'.format(height, 2),
                     ha='center', color='w', fontsize=11)

    # remove all the ticks (both axes), and tick labels on the Y axis
    plt.tick_params(top='off', bottom='off', left='off', right='off', labelleft='off', labelbottom='on')

    # remove the frame of the chart
    for spine in plt.gca().spines.values():
        spine.set_visible(False)

    plt.xticks([0,1,2,3], ['Malignant\nTraining', 'Benign\nTraining', 'Malignant\nTest', 'Benign\nTest'], alpha=0.8);
    plt.title('Training and Test Accuracies for Malignant and Benign Cells', alpha=0.8)
accuracy_plot()