Testing the Altair Shortcode
Table of Contents
Note: This is an example to myself of a post that uses my nikola/altair setup. It isn't something generally relevant to altair itself.
Introduction
The way I've been using altair is by saving the charts as HTML documents and then embedding them into the posts as pages within the page. This works, so I don't know if this is a good idea or not, but I'm going to try embedding them as HTML elements only, the way I do with p5.js. This is a check to make sure I've got the parts working so nikola will compile everything the way I'm expecting it to.
Setup
Imports
These initial imports are for the plotting and not really what this post is testing.
# python
from pathlib import Path

import os

# pypi
from dotenv import load_dotenv
from expects import be_true, expect
from tabulate import tabulate

import altair
import pandas
Next is the function I'm testing - a new function I created in graeae, called save_vega_embed. Which maybe isn't the best name but it shouldn't clash with my other functions, hopefully. Its purpose is to create the JavaScript function that Altair's Chart.save was creating for me in the earlier posts and then save it where nikola can find it.
from graeae.visualization.altair_helpers import output_path, save_vega_embed
Note to self: Since I usually run the code to create the plot on a different machine from the one where the nikola code is being run to create this site, the graeae function has to be installed on the remote machine where the plots are created, then the file(s) created need to be synced back to the nikola machine to compile the site.
The Output Path
The output_path function takes the slug and checks if there's a folder matching it in the files/posts folder and creates it if it doesn't exist. Its output is a Path to that folder which we can use to tell the code where to save files for the chart.
SLUG = "testing-the-altair-shortcode"
OUTPUT_PATH = output_path(SLUG)
expect(OUTPUT_PATH.is_dir()).to(be_true)
Constants
These are some constants so I don't have to remember them later on.
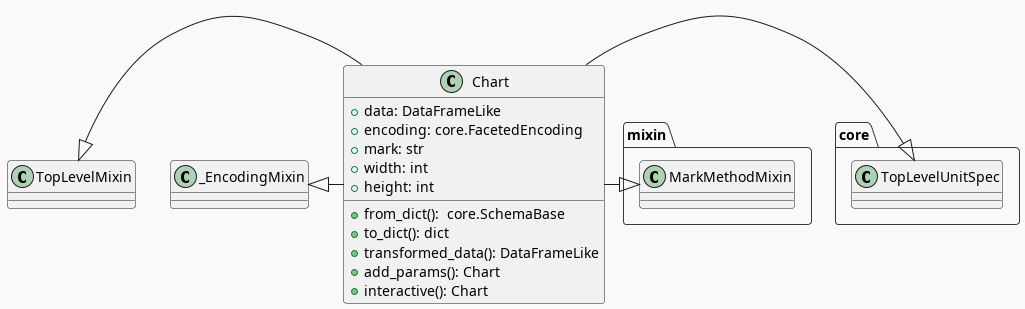
class Chart:
    year = "year"
    height = 600
    width = "container"
Note: The width = "container" attribute will tell the chart to use the entire width of the container that the chart is in. In this case it's being put into a <div> tag. To make the div fill the column the CSS is giving its HTML class (altair-vega) a width of 100%. By default the chart will sit flush left but this way it's centered (and big). I'll have to figure out some other solution to get smaller charts centered.
See the vega-lite "Responsive Width and Height" documentation
The Data
To have something to plot I'll use the United Nation's World Happiness data, which I downloaded (as excel spreadsheets) and converted to a CSV.
load_dotenv(override=True)
table_path = Path(os.getenv("WORLD_HAPPINESS_TABLE"))

expect(table_path.is_file()).to(be_true)

table = pandas.read_csv(table_path)
print(table.shape)
(2199, 11)
This is overkill, but I had the idea to do this while in the middle of another post that uses this dataset so it was convenient to cut-and-paste the block here.
Counting the Years
The test-plot will be a bar-graph showing the number of entries (countries) for each year in the dataset. The data uses "year" as the name of the column with the years so I'll make a little name holder and then create a data-frame with the counts.
year_counts = (table.year.value_counts()
               .reset_index()
               .sort_values(Chart.year))
The value_counts output has the years as the index of the Series so I'm calling reset_index to move it into a column, giving us a two-column data-frame (with "year" and "counts" as columns).
A Table To Show the Counts
This is to show the values that we're going to plot.
table_counts = year_counts.T

table_counts.columns = table_counts.iloc[0]
table_counts = table_counts.drop(table_counts.index[0])
print(tabulate(table_counts, headers="keys", tablefmt="orgtbl"))
| 2005 | 2006 | 2007 | 2008 | 2009 | 2010 | 2011 | 2012 | 2013 | 2014 | 2015 | 2016 | 2017 | 2018 | 2019 | 2020 | 2021 | 2022 | |
|---|---|---|---|---|---|---|---|---|---|---|---|---|---|---|---|---|---|---|
| count | 27 | 89 | 102 | 110 | 114 | 124 | 146 | 141 | 136 | 144 | 142 | 141 | 147 | 141 | 143 | 116 | 122 | 114 |
Now the Bar-Chart
So, here's the section where we get to what we're testing.
First, we need an identifier for the HTML div tag so that we can tell Vega where to stick the chart.
DIV_ID = "value-counts-0d454587"
Now we'll create the altair Chart.
value_counts_chart = altair.Chart(year_counts).mark_bar().encode(
    x="{}:N".format(Chart.year),
    y="count").properties(height=Chart.height, width=Chart.width)
Now to save it. Previously I was using Altair's save method to save it as an HTML document and embedding the entire document within the post using an <object> tag, which seems to work kind of like a frame. I think. Anyway, this version saves the chart as a JavaScript function instead (using the name we pass in for the file-name) which then gets called by vega-embed to create the chart. The graeae.visualization.altair_helpers.save_vega_embed function is extracting the JSON schema from the chart (using Altair's Chart.to_json()) and adding it to a JavaScript function that I copied from the file created by Altair's Chart.save. The graeae function prints the shortcode to tell nikola to embed the chart here and then returns a Path object pointing to the saved file.
Note: I haven't figured out how to get jupyter-emacs to dump python output without formatting it as a #+RESULTS block so it will need a little clean up after the function is called. If not, the shortcode will work, but it will also create an empty box underneath it.
chart_path = save_vega_embed(chart=value_counts_chart,
                             name="value-counts-bar-chart",
                             div_id=DIV_ID,
                             output_path=OUTPUT_PATH)
print(chart_path.name)
value-counts-bar-chart.js
And a Line Plot
I'm going to re-plot the data as a line chart to make sure there's nothing I created that causes them to mess each other up.
line_chart = value_counts_chart.mark_line()

save_vega_embed(line_chart,
                name="value-counts-line-chart",
                div_id="line-chart-0d454587",
                output_path=OUTPUT_PATH)
Note: The altairdiv shortcode sets the HTML class for the chart's div to "altair-vega" in case it needs styling later.
The End
Well, that seems to work. I was originally going to throw this away once things seemed to be all right, but I'll keep it as a future reference in case I forget how to use this stuff later.
Here's the files that were updated to make this work.
- shortcodes/altairdiv.tmpl
- themes/custom-jinja/templates/
- altair.tmpl
- altair_helper.tmpl
- index.tmpl
As well as graeae.visualization.altair_helpers.save_vega_embed.
To get the post working it needs .. template: altair.tmpl in the meta-data and the output of the save_vega_embed function cleaned up (to get the shortcode to include the chart).
Links
- Saving Altair Charts — Vega-Altair 5.2.0 documentation [Internet]. [cited 2024 Mar 16]. Available from: https://altair-viz.github.io/user_guide/saving_charts.html
- vega/vega-embed [Internet]. Vega; 2024 [cited 2024 Mar 16]. Available from: https://github.com/vega/vega-embed
- Vega-Lite [Internet]. [cited 2024 Mar 20]. Customizing Size. Available from: https://vega.github.io/vega-lite/docs/size.html
- World Happiness Report [Internet]. 2023 [cited 2023 Dec 11]. Available from: https://worldhappiness.report/


