Setting up pytest

What is this about?

This is a post to generate and document the pytest.ini configuration for testing.

Requirements

The Neurotic Repository

To make the neurotic code importable you need to install the package (in development mode, since it's (hopefully) always changing) using pip.

pip install --editable .

The Testing Dependencies

There are some things that need to be installed to get the code to run (like numpy and nltk) but for the testing this is what's needed.

expects
faker
pytest
pytest-bdd
pytest-mock
pytest-xdist

This list is in a text-file (tests/testing-requriements) so they can be installed by changing into the tests folder and running pip.

pip install --requirement testing-requirements

The Configuration File

Pytest can read in an INI formatted file. It has a bunch of configuration options but I haven't really explored them much. I mostly use it to set the command line arguments that I would otherwise pass in.

The Header

This is just the pytest section header so pytest knows to look here.

[pytest]

The Pytest BDD Features Base

Pytest-bdd will look for a feature file in the same folder as the test-file, unless you tell it not to, so let's tell it to look in the sub-folder named "features" instead.

bdd_features_base_dir = features/

The Regular Testing Run

addopts = --exitfirst --failed-first --color yes --gherkin-terminal-reporter
          --looponfail --numprocesses auto

I didn't realize it before, but as this stackoverflow answer mentions, you can break up long line in INI files (assuming that the code is using python's ConfigParser) by indenting the continuation lines (although it appears, unfortunately, to break pygments' syntax highlighting).

Here's a breakdown of the options.

  • exitfirst: stop testing after the first failed test
  • failed-first: when re-starting the tests, start with the test that failed
  • color yes: Add some highlight-coloring to the pytest output
  • gherkin-terminal-reporter: Format the output using pytest-bdd
  • looponfail: re-run the testing if a file changes
  • numprocesses auto: Run the tests in parallel across all available cores.

The numprocesses option can alternatively take logical as an argument, meaning use all logical CPUs, not physical cores (this requires you install pytest-xdist[psutil]) or the actual number of processes you want to run in parallel.

The Run-Once

This removes the automatic re-running of tests. I don't really use this, but sometimes it can be helpful, especially when using something like Selenium that slows everything down a lot, to not re-run the test every time you save a file.

# addopts = --exitfirst --failed-first --color yes --gherkin-terminal-reporter --numprocesses auto

The PUDB Run

pytest will grab standard out by default, making it impossible to run an interactive debugger. They have support for python's pdb debugger, but I use pudb instead, so this set of arguments turns off the capturing of standard out which will let you run the tests with PUDB. There is a project that integrates pudb into pytest, but it appears to have died out, so I'll just stick to my old way of doing it.

# addopts = --exitfirst --failed-first --color yes --gherkin-terminal-reporter --capture=no

Links

DuckDuckGo Image Search

DuckDuckGo Image Search

This is a post for some notes on the ddg_images function from the duckduckgo-search library (link to GitHub) which downloads images using duckduckgo (and thus bing in a way).

The Parameters

Let's start by looking at the arguments that the function takes.

from duckduckgo_search import ddg_images

print(ddg_images.__doc__)
DuckDuckGo images search. Query params: https://duckduckgo.com/params

    Args:
        keywords (str): keywords for query.
        region (str, optional): wt-wt, us-en, uk-en, ru-ru, etc. Defaults to "wt-wt".
        safesearch (str, optional): On, Moderate, Off. Defaults to "Moderate".
        time (Optional[str], optional): Day, Week, Month, Year. Defaults to None.
        size (Optional[str], optional): Small, Medium, Large, Wallpaper. Defaults to None.
        color (Optional[str], optional): color, Monochrome, Red, Orange, Yellow, Green, Blue,
            Purple, Pink, Brown, Black, Gray, Teal, White. Defaults to None.
        type_image (Optional[str], optional): photo, clipart, gif, transparent, line.
            Defaults to None.
        layout (Optional[str], optional): Square, Tall, Wide. Defaults to None.
        license_image (Optional[str], optional): any (All Creative Commons), Public (PublicDomain),
            Share (Free to Share and Use), ShareCommercially (Free to Share and Use Commercially),
            Modify (Free to Modify, Share, and Use), ModifyCommercially (Free to Modify, Share, and
            Use Commercially). Defaults to None.
        max_results (int, optional): maximum number of results, max=1000. Defaults to 100.
        output (Optional[str], optional): csv, json, print. Defaults to None.
        download (bool, optional): if True, download and save images to 'keywords' folder.
            Defaults to False.

    Returns:
        Optional[List[dict]]: DuckDuckGo text search results.

Hopefully the arguments are pretty straight forward. I couldn't find an official help page for image searches but they seem pretty straight-forward.

The Output

Let's do a search for images of lop-eared rabbits and then take a look at what ddg_images returns.

output = ddg_images("rabbit lop", type_image="photo",
                    license_image="public", 
                    max_results=1)
pprint(output[0])
{'height': 848,
 'image': 'https://cdn.pixabay.com/photo/2015/12/22/20/27/animals-1104748_1280.jpg',
 'source': 'Bing',
 'thumbnail': 'https://tse1.mm.bing.net/th?id=OIP.lEqFD_LPmRGbc1GyIUoNygHaE6&pid=Api',
 'title': 'Flemish Lop Rabbit Very · Free photo on Pixabay',
 'url': 'https://pixabay.com/en/flemish-lop-rabbit-rabbit-1104748/',
 'width': 1280}

I thought that the output argument would change the format of the returned values but it instead seems to direct the values to a file (counting stdout as a file) and then return the same function output as before. Here's what "print" does'.

output = ddg_images("rabbit lop", type_image="photo",
                    license_image="public",
                    output="print",
                    max_results=1)

print(output[0])
1. {
    "title": "Flemish Lop Rabbit Very · Free photo on Pixabay",
    "image": "https://cdn.pixabay.com/photo/2015/12/22/20/27/animals-1104748_1280.jpg",
    "thumbnail": "https://tse1.mm.bing.net/th?id=OIP.lEqFD_LPmRGbc1GyIUoNygHaE6&pid=Api",
    "url": "https://pixabay.com/en/flemish-lop-rabbit-rabbit-1104748/",
    "height": 848,
    "width": 1280,
    "source": "Bing"
}
{'title': 'Flemish Lop Rabbit Very · Free photo on Pixabay', 'image': 'https://cdn.pixabay.com/photo/2015/12/22/20/27/animals-1104748_1280.jpg', 'thumbnail': 'https://tse1.mm.bing.net/th?id=OIP.lEqFD_LPmRGbc1GyIUoNygHaE6&pid=Api', 'url': 'https://pixabay.com/en/flemish-lop-rabbit-rabbit-1104748/', 'height': 848, 'width': 1280, 'source': 'Bing'}

Under The Hood

I was hoping that I'd be able to link to some official documentation to explain what's going on, but from what I can tell duckduckgo doesn't have an advertised API for its image search, and duckduckgo-search isn't too heavily documented, but if you look at the duckduckgo-search code it appears to be using a special token (vqd) that you can use to make queries to a special endpoint (https://www.duckduckgo.com/i.js) that you can use to get the search results from, which I couldn't find documented in the duckduckgo-search repository but is mentioned in this StackOverflow answer. I don't know how they figured it out, but using the vqd parameter and o=json makes it work pretty much like an API, although the code is also handing pagination so it seems almost like a hybrid web-scraping and API request.

The VQD

I'll show a request for "rabbit lop" using URL parameters. The actual code is using the requests library and sends them as a payload dictionary instead, but I thought it might be more familiar to see them as URL parameters (and it makes it so you can copy and paste the output into a browser to see what happens).

The first thing that ddg_images does is make a POST request to "https://duckduckgo.com/" using the search terms as data ({q="rabbit lop"}).

This returns some HTML, within which is some javascript that contains the "vqd" value that we need to pass in as an argument to make the proper search query.

<script type="text/JavaScript">
  function nrji() {
    nrj('/t.js?q=rabbit%20lop&l=us-en&s=0&dl=en&ct=US&ss_mkt=us&p_ent=&ex=-1&dfrsp=1')
    DDG.deep.initialize('/d.js?q=rabbit%20lop&l=us-en&s=0&dl=en&ct=US&ss_mkt=us&vqd=3-175223187338608511244788076450682226312-294342034741290420994864096532891255767&p_ent=&ex=-1&sp=1&dfrsp=1');;
  }
  DDG.ready(nrji, 1)
</script>

The "vqd" is one of the arguments to the DDG.deep.initialize function in the javascript/HTML that's returned from the request and the duckduckgo-search code extracts it using substring searching, giving us just the vqd.

vqd=3-175223187338608511244788076450682226312-294342034741290420994864096532891255767

Then a second request is made using the VQD token as one of the parameters along with whatever other parameters you want - in this case we're setting the region (l=wt-wt meaning "no region"), asking that the response be JSON (o=json), using the keywords "rabbit lop" (q="rabbit lop"), and turning safe-search off (p=-1). To make it work you also need to send the request to a special endpoint https://duckduckgo.com/i.js. So we end up with a request that looks like this:

https://duckduckgo.com/i.js?q=rabbit+lop&o=json&l=wt-wt&s=0&f=%2C%2C%2Ctype%3Aphoto%2C%2Clicense%3Apublic&p=-1&vqd=3-175223187338608511244788076450682226312-294342034741290420994864096532891255767

The payload to the response is a JSON blob that gets converted by the python code into a dictionary (if you paste the example url into a browser address bar you should be able to see the response).

Python Translation

The previous section was my attempt to explain to myself more or less how the code works, but I thought it might be easier to understand if we steal some of the code from duckduckgo-search and modify it to get a single output more or less the way ddg_images does it..

First we set up our requests session.

import requests

HEADERS = {
    "User-Agent": "Mozilla/5.0 (Windows NT 10.0; rv:102.0) Gecko/20100101 Firefox/102.0",
    "Referer": "https://duckduckgo.com/",
}

SESSION = requests.Session()
SESSION.headers.update(HEADERS)

Now we get the vqd by doing a POST and then searching the returned HTML for the string.

payload = dict(q="rabbit lop")

response = SESSION.post("https://duckduckgo.com", data=payload, timeout=10)

PREFIX = b"vqd='"

vqd_index_start = response.content.index(PREFIX) + len(PREFIX)
vqd_index_end = response.content.index(b"'", start=vqd_index_start)

vqd_bytes = response.content[vqd_index_start:vqd_index_end]

# convert it from bytes back to a string before using it as a payload value
vqd = vqd_bytes.decode()
print(vqd)
3-175223187338608511244788076450682226312-294342034741290420994864096532891255767

Now that we have the VQD (whatever it is) we can make our actual search request by building up the payload dictionary and sending the request to duckduckgo.

payload["o"] = "json"
payload["l"] = "wt-wt"
payload["s"] = 0
payload["f"] = ",,,type:photo,,license:public"
payload["p"] = -1
payload["vqd"] = vqd

response = SESSION.get("https://duckduckgo.com/i.js", params=payload)

The response contains multiple search results but let's unpack the first one as a demonstration.

page_data = response.json()["results"]

row = page_data[0]

output = {
    "title": row["title"],
    "image": row["image"],
    "thumbnail": row["thumbnail"],
    "url": row["url"],
    "height": row["height"],
    "width": row["width"],
    "source": row["source"],
}

SESSION.close()
pprint(output)
{'height': 848,
 'image': 'https://cdn.pixabay.com/photo/2015/12/22/20/27/animals-1104748_1280.jpg',
 'source': 'Bing',
 'thumbnail': 'https://tse1.mm.bing.net/th?id=OIP.lEqFD_LPmRGbc1GyIUoNygHaE6&pid=Api',
 'title': 'Flemish Lop Rabbit Very · Free photo on Pixabay',
 'url': 'https://pixabay.com/en/flemish-lop-rabbit-rabbit-1104748/',
 'width': 1280}

The ddg_images function is doing more than this, but for future reference, here's the basics of what's going on and how the author made the search work.

FastAI: Picking the Best Model

In the Beginning

In this notebook we'll go over the fastai course lesson 3 - "Which image models are best?". We'll use the benchmarking data from timm, a collection of pyTorch IMage Models to compare how different computer vision models performed using time-per-image and accuracy as our metrics.

Imports and Setup

# from python
from functools import partial
from pathlib import Path

# from pypi
from tabulate import tabulate

import altair
import pandas

# monkey
from graeae.visualization.altair_helpers import output_path, save_chart
TABLE = partial(tabulate, tablefmt="orgtbl", headers=["Column", "Value"] )

PLOT_WIDTH, PLOT_HEIGHT = 900, 600
SLUG = "fastai-picking-the-best-model"
OUTPUT_PATH = output_path(SLUG)
save_it = partial(save_chart, output_path=OUTPUT_PATH)

The Validation Data

We'll be using data that's part of the git repository for timm . Once you clone the repository the first file within it that we want will be results/results-imagenet.csv. This is the result of using the Imagenet Validation set to validate the models.

RESULTS = Path("~/projects/third-party/"
               "pytorch-image-models/results").expanduser()
DATA = RESULTS/"results-imagenet.csv"
validation = pandas.read_csv(DATA)

print(TABLE(validation.iloc[0].to_frame()))
Column Value
model beit_large_patch16_512
top1 88.602
top1_er r 11.398
top5 98.656
top5_err 1.344
param_count 305.67
img_size 512
crop_pct 1.0
interpolation bicubic

This table shows the first row of the results-imagenet CSV. Each row represents a computer vision model and some information about how it performed during validation. The documentation says that top1 and top5 are "top-1/top-5 differences from clean validation." Which means… what? Looking at the validate.py file it appears that top1 and top5 are measures of accuracy. Looking in the utils.metrics.py module the function accuracy has a docstring that says: Computes the accuracy over the k top predictions for the specified values of k. The top1 and top5 are AverageMeter objects that keep a running average of their accuracies.

This seems straightforward enough, but if you look at that first row the top1 is smaller than the top5 and has a larger error…

Guessing by the name, the model in our row is an instance of "BEIT: BERT Pre-Training of Image Transformers (https://arxiv.org/abs/2106.08254)" found in timm's beit.py module.

print(validation.shape)
(668, 9)

The model column is the string you use when creating a model and also refers to a function in one of the pytorch-image-models/timm/models modules. If you want to see how the model in our example row is defined, look in the timm/models/beit.py module for a function named "beit_large_patch16_512". You should find something like this.

@register_model
def beit_large_patch16_512(pretrained=False, **kwargs):
    model_kwargs = dict(
        img_size=512, patch_size=16, embed_dim=1024, depth=24, num_heads=16, mlp_ratio=4, qkv_bias=True,
        use_abs_pos_emb=False, use_rel_pos_bias=True, init_values=1e-5, **kwargs)
    model = _create_beit('beit_large_patch16_512', pretrained=pretrained, **model_kwargs)
    return model

So we can now see that besides being a BEIT model the name tells us that it used an image size of 512 and a patch size of 16. Further up the file is this configuration:

'beit_large_patch16_512': _cfg(
    url='https://conversationhub.blob.core.windows.net/beit-share-public/beit/beit_large_patch16_512_pt22k_ft22kto1k.pth',
        input_size=(3, 512, 512), crop_pct=1.0,

Which tells you where the pretrained weights came from.

The Benchmark Data

We're going to merge our "validation" data with two "benchmark" files (also in the "results" folder) doing some cryptic filtering and data wrangling. It's not obvious what everything is doing so let's use it first and maybe figure out most of it later. The main things to note is that we're adding a family column made by taking the first token from the model name (e.g. the model beit_large_patch16_512 gets the family beit), we're adding a secs column by inverting the samples-per-second column, and filtering the models down to a subset that are useful to look at.

BENCHMARK_FILE = ("benchmark-{infer_or_train}"
                  "-amp-nhwc-pt111-cu113-rtx3090.csv")
SAMPLE_RATE = "{infer_or_train}_samples_per_sec"
FAMILY_REGEX = r'^([a-z]+?(?:v2)?)(?:\d|_|$)'
FAMILY_FILTER = r'^re[sg]netd?|beit|convnext|levit|efficient|vit|vgg'

def get_data(infer_or_train: str,
             validation: pandas.DataFrame=validation) -> pandas.DataFrame:
    """Load a benchmark dataframe

    Args:
     infer_or_train: part of filename with label (infer or train)
     validation: DataFrame created from validation results file

    Returns:
     benchmark data merged with validation
    """

    frame = pandas.read_csv(
        RESULTS/BENCHMARK_FILE.format(
            infer_or_train=infer_or_train)).merge(
        validation, on='model')
    frame['secs'] = 1. / frame[SAMPLE_RATE.format(infer_or_train=infer_or_train)]
    frame['family'] = frame.model.str.extract(FAMILY_REGEX)
    frame = frame[~frame.model.str.endswith('gn')]
    IN_FILTERER = frame.model.str.contains('in22'), "family"
    frame.loc[IN_FILTERER] = frame.loc[IN_FILTERER] + '_in22'

    RESNET_FILTERER = frame.model.str.contains('resnet.*d'),'family'
    frame.loc[RESNET_FILTERER] = frame.loc[RESNET_FILTERER] + 'd'
    return frame[frame.family.str.contains(FAMILY_FILTER)]

Build The Base Chart

The build_chart function is going to help us build the basic chart to compare the merged validation and benchmark values for the models.

SELECTION = altair.selection_multi(fields=["family"], bind="legend")
COLUMNS = ["secs", "top1", "family", "model"]

def build_chart(frame: pandas.DataFrame, infer_or_train: str,
                add_selection: bool=True) -> altair.Chart:
    """Build the basic chart for our benchmarks

    Note:
     the ``add_selection`` function can only be called once on a chart so to
     add more layers don't add it here, add it later to the end

    Args:
     frame: benchmark frame to plot
     infer_or_train: which image size column (infer | train)
     add_selection: whether to add the selection at the end
    """
    # altair includes all the data even if it's not used in the plot
    # reducing the dataframe to just the data you need
    # makes the file smaller
    SIZE = f"{infer_or_train}_img_size"
    frame = frame[COLUMNS + [SIZE]]
    chart = altair.Chart(frame).mark_circle().encode(
        x=altair.X("secs", scale=altair.Scale(type="log"),
                   axis=altair.Axis(title="Seconds Per Image (log)")),
        y=altair.Y("top1",
                   scale=altair.Scale(zero=False),
                   axis=altair.Axis(title="Imagenet Accuracy")),
        size=altair.Size(SIZE,
                         scale=altair.Scale(
                             type="pow", exponent=2)),
        color="family",
        tooltip=[altair.Tooltip("family", title="Architecture Family"),
                 altair.Tooltip("model", title="Model"),
                 altair.Tooltip(SIZE, format=",", title="Image Size"),
                 altair.Tooltip("top1", title="Accuracy"),
                 altair.Tooltip("secs", title="Time (sec)", format=".2e")
                 ]
        )
    if add_selection:
        chart = chart.encode(opacity=altair.condition(
                SELECTION,
                altair.value(1),
                altair.value(0.1))
        ).add_selection(SELECTION)
    return chart

Plot All the Architectures

Our first chart for the benchmarking data will plot all the models left in the data-frame after our filtering and merging to show us how they compare for accuracy and average time to process a sample.

def plot_it(frame: pandas.DataFrame,
            title: str,
            filename: str,
            infer_or_train: str,
            width: int=PLOT_WIDTH,
            height: int=PLOT_HEIGHT) -> None:
    """Make an altair plot of the frame

    Args:
     frame: benchmark frame to plot
     title: title to give the plot
     filename: name of file to save the chart to
     infer_or_train: which image size column (infer or train)
     width: width of plot in pixels
     height: height of plot in pixels
    """
    chart = build_chart(frame, infer_or_train).properties(
        title=title,
        width=width,
        height=height,
    )

    save_it(chart, filename)
    return

Plot Some of the Architectures

To make it easier to understand, the author of the fastai lesson chose a subset of the families to plot.

  • beit
  • convnext
  • efficientnetv2
  • levit
  • regnetx
  • resnetd
  • vgg

Note: The fastai notebook points out that because of the different sample sizes used to train the models it isn't a simple case of picking the "best" performing model (given a speed vs accuracy trade off). The pytorch-image-models repository has information to help research what went into the training.

FAMILIES = 'levit|resnetd?|regnetx|vgg|convnext.*|efficientnetv2|beit'

def subset_regression(frame: pandas.DataFrame,
                      title: str,
                      filename: str,
                      infer_or_train: str,
                      width: int=PLOT_WIDTH,
                      height: int=PLOT_HEIGHT) -> None:
    """Plot subset of model-families

    Args:
     frame: frame with benchmark data
     title: title to give the plot
     filename: name to save the file
     infer_or_train: which image size column
     width: width of plot in pixels
     height: height of plot in pixels
    """
    subset = frame[frame.family.str.fullmatch(FAMILIES)]

    base = build_chart(subset, infer_or_train, add_selection=False)

    line = base.transform_regression(
        "secs", "top1",
        groupby=["family"],
        method="log",
        ).mark_line().encode(
            opacity=altair.condition(
                SELECTION,
                altair.value(1),
                altair.value(0.1)
            ))

    chart = base.encode(
        opacity=altair.condition(
        SELECTION,
        altair.value(1),
        altair.value(0.1)
    ))

    chart = altair.layer(chart, line).properties(
        title=title,
        width=width,
        height=height,
    ).add_selection(SELECTION)

    save_it(chart, filename)
    return

Inference

The first benchmarking data we're going to add is the inference data. Unfortunately I haven't been able to find out what this means, exactly - was this a test of categorizing a test set? It only adds the average sample time to what we're going to plot, which perhaps isn't as interesting as the accuracy anyway.

inference = get_data('infer')
print(TABLE(inference.iloc[0].to_frame()))
Column Value
model levit_128s
infer_samples_per_sec 21485.8
infer_step_time 47.648
infer_batch_size 1024
infer_img_size 224
param_count_x 7.78
top1 76.514
top1_err 23.486
top5 92.87
top5_err 7.13
param_count_y 7.78
img_size 224
crop_pct 0.9
interpolation bicubic
secs 4.654236751715086e-05
family levit

Let's look at a row of what was added to our original validation data.

added = inference[list(set(inference.columns) - set(validation.columns))].iloc[0]
print(TABLE(added.to_frame()))
Column Value
secs 4.654236751715086e-05
family levit
param_count_y 7.78
infer_batch_size 1024
param_count_x 7.78
infer_samples_per_sec 21485.8
infer_step_time 47.648
infer_img_size 224

If you look back at get_data you'll see that we added the sec column which is defined as \(\frac{1}{\textit{samples per second}}\). So it's the averaged(?) seconds per sample. I think.

Let's see how evenly distributed the families are.

counts = inference.family.value_counts().to_frame().reset_index().rename(
    columns = {"index": "Family", "family": "Count"})

chart = altair.Chart(counts).mark_bar().encode(
    x="Count", y=altair.Y("Family", sort="-x"), tooltip=["Count"],
).properties(
    width=PLOT_WIDTH,
    height=PLOT_HEIGHT,
    title="Inference Family Counts"
)

save_it(chart, "inference-family-counts")

Figure Missing

There doesn't seem to be an even representation of model families. Let's look at the accuracy vs the speed for the models.

plot_it(inference, title="Inference", 
        filename="inference-benchmark",
        infer_or_train="infer")

Figure Missing

While we still don't have an explanation of exactly what we're looking at, in the broadest it's a plot of the time it takes for a model to process an image (in seconds on a logarithmic scale) versus the accuracy when categorizing the Imagenet dataset.

  • The color matches the family in the legend.
  • The size is proportional to the number of seconds it took.
  • Clicking on a family in the legend will highlight it and suppress the other families.
  • Hovering over a circle gives the exact information for that point.

I believe that the accuracy is the best performance for a model, so even though a family might have multiple points in the plot, each model will only have one point to represent its best accuracy and the time it took.

A Subset

To make it easier to see what's going on the author(s) of the fastai lesson paired down the dataset to a subset of families and then added regression lines to compare them.

subset_regression(inference,
                  title="Inference Subset",
                  filename="inference-subset-benchmark",
                  infer_or_train="infer")

Figure Missing

Training

training = get_data("train")
plot_it(training, title="Training", 
        filename="training-benchmark",
        infer_or_train="train")

Figure Missing

subset_regression(training,
                  title="Training Subset",
                  filename="training-subset-benchmark",
                  infer_or_train="train")

Figure Missing

Parameters Vs Time

The fastai notebook plots the model parameters vs time (speed), saying that parameters are sometimes used as a proxy for speed and memory use (to make it machine independent, presumably), but then says that it isn't always a good proxy. Once more they give us a tool and then tell us it isn't necessarily what to use.

plotter = inference[["param_count_x", "secs", "infer_img_size", "family", "model", "top1"]]
chart = altair.Chart(plotter).mark_circle().encode(
    x=altair.X("param_count_x", scale=altair.Scale(type="log"),
               axis=altair.Axis(title="Parameters (log)")),
    y=altair.Y("secs", scale=altair.Scale(type="log", zero=False),
               axis=altair.Axis(title="Seconds Per Image (log)")),
    color="infer_img_size",
    tooltip=[altair.Tooltip("family", title="Architecture Family"),
             altair.Tooltip("model", title="Model"),
             altair.Tooltip("infer_img_size", format=",", title="Image Size"),
             altair.Tooltip("top1", title="Accuracy"),
             altair.Tooltip("secs", title="Time (sec)", format=".2e")
             ],
    opacity=altair.condition(
        SELECTION,
        altair.value(1),
        altair.value(0.1))
).add_selection(SELECTION).properties(
    title="Parameters Vs Time",
    width=PLOT_WIDTH,
    height=PLOT_HEIGHT-100)

save_it(chart, "inference-parameters-vs-time")

Figure Missing

In this case it looks like parameters and speed are correlated, as it takes more time the more parameters there are, but it's confounded by the fact that the models with more parameters seem to be handling bigger images.

Accuracy Vs Size

The fastai

plotter = inference[["param_count_x", "img_size",
                     "family", "model", "secs", "top1"]]
chart = altair.Chart(plotter).mark_circle().encode(
    x=altair.X("img_size", scale=altair.Scale(zero=False),
               axis=altair.Axis(title="Image Size")),
    y=altair.Y("top1",
               scale=altair.Scale(zero=False),
               axis=altair.Axis(title="Accuracy")),
    size=altair.Size("secs", scale=altair.Scale(type="log")),
    color="family",
    tooltip=[altair.Tooltip("family", title="Architecture Family"),
             altair.Tooltip("model", title="Model"),
             altair.Tooltip("img_size", format=",", title="Image Size"),
             altair.Tooltip("top1", title="Accuracy"),
             altair.Tooltip("secs", title="Time (sec)", format=".2e")
             ],
    opacity=altair.condition(
        SELECTION,
        altair.value(1),
        altair.value(0.1))
).add_selection(SELECTION).properties(
    title="Accuracy Vs Image Size",
    width=PLOT_WIDTH,
    height=PLOT_HEIGHT-100)

save_it(chart, "inference-accuracy-vs-size")

Figure Missing

Sources

FastAI: Saving a Model

Redoing The Cats and Dogs

# python
from pathlib import Path

#fastai
from fastai.vision.all import (
    error_rate,
    get_image_files,
    ImageDataLoaders,
    load_learner,
    Resize,
    resnet34,
    untar_data,
    URLs,
    vision_learner,
)

path = untar_data(URLs.PETS)/'images'

def its_a_cat(filename: str) -> bool:
    """Checks if the filename looks like a cat

    Args:
     filename: name of the image file

    Returns:
     True if the first letter of the filename is upper-cased
    """
    return "cat" if filename[0].isupper() else "dog"

loader = ImageDataLoaders.from_name_func(
    path,
    get_image_files(path),
    valid_pct=0.2,
    seed=42,
    label_func=its_a_cat,
    item_tfms=Resize(224)
)
learner = vision_learner(
    loader, resnet34, metrics=error_rate)

model = learner.to_fp16()
with model.no_bar():
    model.fine_tune(1)
[0, 0.12685242295265198, 0.019196458160877228, 0.00405954010784626, '00:19']
[0, 0.06199510768055916, 0.016171308234333992, 0.0067658997140824795, '00:25']

Saving the Model

You can either save the underlying pytorch model or the fastai Learner. We want the simpler way so we'll save the fastai Learner.

MODEL_PATH = '/tmp/model.pkl'
model.export(MODEL_PATH)

Loading the Model

Weirdly, the original fastai jupyter notebook doesn't tell you how to load the model once you've saved it, but I'm assuming that this is the way to do it.

relearner = load_learner(fname=MODEL_PATH)

 test-cat.jpg

def check_model(image_path: str) -> None:
    image_path = Path(image_path).expanduser()

    with relearner.no_bar():
        category, location, probablilities = relearner.predict(image_path)
    print(f"I think this is a {category}.")
    print(f"The probability that it's a {category} is"
          f" {probablilities[location.item()].item():.2f}")
    return

check_model("~/test-cat.jpg")
I think this is a cat.
The probability that it's a cat is 1.00

 test-dog.jpg

check_model("~/test-dog.jpg")
I think this is a dog.
The probability that it's a dog is 1.00

Raccoon Or Raccoon Dog?

What Is This?

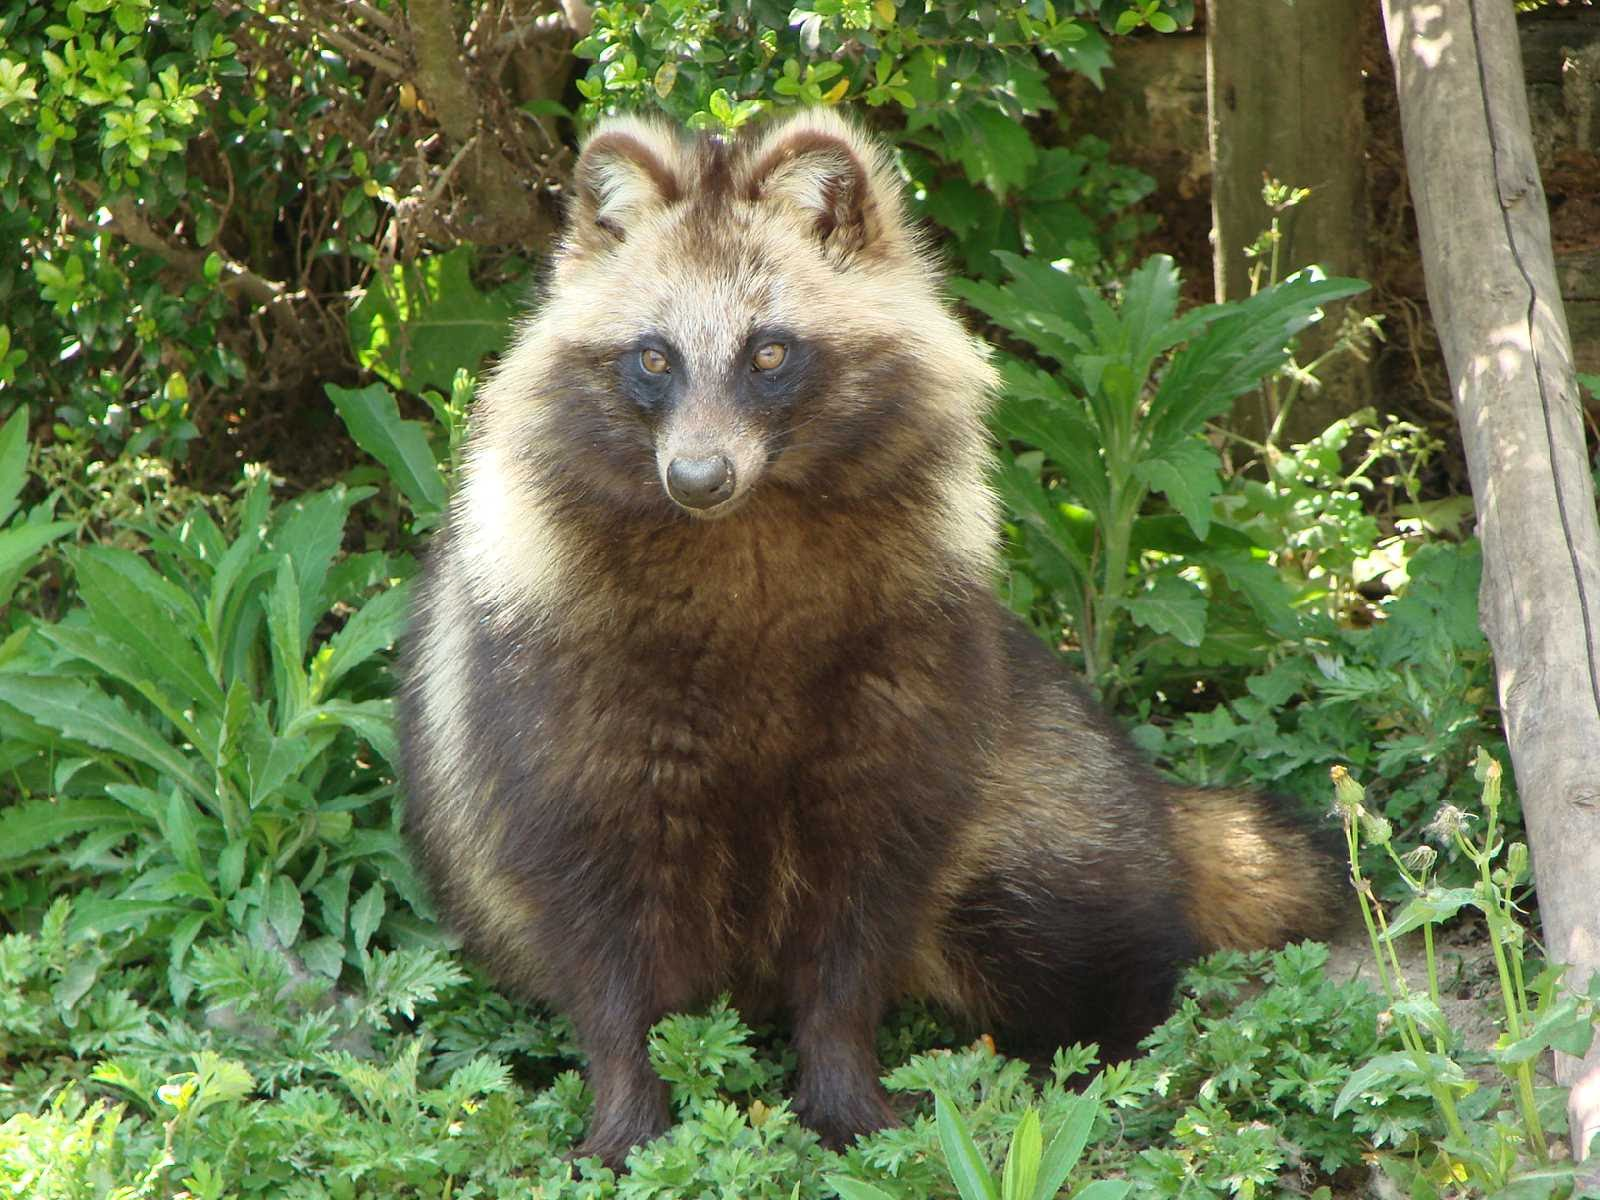
This is a run-through of some of the ideas from Lesson 0 of the FastAI Practical Deep Learning for Coders course (sort of, there's a 2022 version that I'm using which doesn't seem to exactly match the lectures on the website). In it we search for photos using a search engine and build a neural-network to classify the images that belong to one of the two classes of photos that we use. This is an image classification example, like the Cats vs Dogs post but it has the added feature of demonstrating how to build your own dataset using a search-engine. I'll be using Tanuki (the Japanese Raccoon Dog) and Raccoon images as the categories to classify.

Imports

For the search engine we'll use DuckDuckGo via the duckduckgo-search package (from pypi) and its ddg_images function..

# python
from functools import partial
from pathlib import Path
from time import sleep

import os, warnings

# pypi
from duckduckgo_search import ddg_images
from dotenv import load_dotenv

import torch

# fastai
from fastai.data.all import (
    CategoryBlock,
    DataBlock,
    parent_label,
    RandomSplitter,
)
from fastai.vision.all import (
    download_images,
    get_image_files,
    ImageBlock,
    Resize,
    resnet18,
    resize_images,
    verify_images,
    vision_learner,
    error_rate,
    PILImage,
)

from fastcore.net import urlsave

# monkey shines
from graeae import Timer

TIMER = Timer()
load_dotenv()

DATA_PATH = Path(os.environ["FASTAI_DATA"])/"raccoon-vs-tanuki"
assert torch.cuda.is_available()

Note: The DATA_PATH is where we're going to store the images we download. We are going to use a function (parent_label) that uses the folders within this directory to label the images within the folders (so images in a folder named "herbert" will be labeled "herbert"). This means that it should only have the folders that we are going to use to build the model. I originally set it to the fastai root root data path which then made the data loader think that all the other data folders were labels as well, so I created a sub-folder named "raccoon-vs-tanuki" to isolate the images I need to train the model.

Getting the Images

We're going to create an alias for the ddg_images function to make the search and then return only the URLs of the images (or their thumbnails) that DuckDuckGo finds.

def get_image_urls(keywords: str,
                   max_images: int=200,
                   license_image: str="any",
                   key="image") -> list:
    """Search duckduckgo images

    Args:
     keywords: A string with keywords to give to duckduckgo
     max_images: the upper limit for how many images to return

    Returns:
     a list-like object with the URLs of the images found
    """
    return [output.get(key) for output in 
            ddg_images(keywords,
                       type_image="photo",
                       license_image=license_image,
                       max_results=max_images)]

A Test Of Tanuki

We'll start by checking that our searcher is working using the keywords "tanuki" and "racoon". First, what does ddg_images return when we search for tanuki?

o = ddg_images("tanuki", type_image="photo", max_results=1)
print(o)
[{'title': 'Tanuki | Animal Jam Fanon Wiki | Fandom', 'image': 'https://vignette.wikia.nocookie.net/ajfanideas/images/6/6a/God_damnit.png/revision/latest?cb=20190222141158', 'thumbnail': 'https://tse3.mm.bing.net/th?id=OIP.74LPltCuN75QxFq2RHLhywHaFj&pid=Api', 'url': 'https://ajfanideas.fandom.com/wiki/Tanuki', 'height': 1200, 'width': 1600, 'source': 'Bing'}]

So it looks like it returns a list of json/dict objects. I'll print it out in a table to maybe make it easier to see. First, the title contains 'pipes' that break the table so I'll replace them with dashes.

o[0]["title"] = o[0]["title"].replace("|", ",")

Now the table.

print("|Key | Value|")
print("|-+-|")
for key, value in o[0].items():
    print(f"|{key}| {value}|")
Key Value
title Tanuki , Animal Jam Fanon Wiki , Fandom
image latest?cb=20190222141158
thumbnail https://tse3.mm.bing.net/th?id=OIP.74LPltCuN75QxFq2RHLhywHaFj&pid=Api
url https://ajfanideas.fandom.com/wiki/Tanuki
height 1200
width 1600
source Bing

Looking at the image URL you might not guess that it was an image of a tanuki (is the tanuki named "God damnit"?), but the title suggests that it is. Interestingly, if you follow the URL to the page where the image comes from you'll see that it's a wiki dedicated to a game called "Animal Jam" but the author of the page says that they couldn't find an image of the tanuki from the game so it is, indeed, a photo of a real tanuki, not a game character.

That's the output of ddg_images but we created get_image_urls to make it a little simpler to get just the URLs so let's search for "tanuki" images again but this time I'm going to download and show the image so I'll specify that I want to pull the image from the Public Domain.

TANUKI_URLS = get_image_urls("tanuki", max_images=1, license_image="Public")
print(TANUKI_URLS[0])
https://c.pxhere.com/photos/04/ff/animal_marten_raccoon_dog_tanuki_enok_obstfuchs_omnivore_fur-705793.jpg!d

The images are usually pretty big so let's download a thumbnail of the image and take a look at it to make sure we're getting the image we expect. The original fastai notebook uses the fastai download_url function (which appears to come from another fastai project called fastdownload (github, documentation)) but, it looks like all this function is doing is starting a progress bar (which I can't use here) and then calling urlsave from another fastai library called fastcore (documentation) so I'll use urlsave instead.

THUMBS = get_image_urls("tanuki", max_images=1, license_image="Public", key="thumbnail")
TANUKI_OUTPUT = "/tmp/tanuki_thumb.jpg"
urlsave(url=THUMBS[0], dest=TANUKI_OUTPUT)

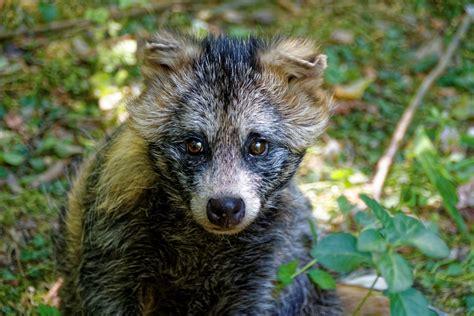
And Here's the thumbnail we downloaded.

tanuki_thumb.jpg

Seems to work. One disadvantage to using the get_image_urls to alias the ddg_images function is that we end up throwing away the other information, so to get the source URL to see the page where the image comes from we have to make another function call.

print(get_image_urls("tanuki", max_images=1, license_image="Public", key="url")[0])
https://pxhere.com/en/photo/705793

This image comes from pxhere.com which appears to be a public domain image hosting site.

Now for the raccoon.

RACCOON_OUTPUT = "/tmp/raccoon_thumb.jpg"
RACCOON_URLS = get_image_urls("raccoon",
                             max_images=1,
                             license_image="Public", key="thumbnail")

urlsave(url=RACCOON_URLS[0],
        dest=RACCOON_OUTPUT)

raccoon_thumb.jpg

print(get_image_urls("raccoon",
                     max_images=1,
                     license_image="Public", key="url")[0])
http://www.publicdomainpictures.net/view-image.php?image=33712&picture=raccoon-4&large=1

Build A Data Set

Now that we've done a little check of what our function does we can move on to creating our dataset using it. When you download an archived dataset from fastai it saves it to the ~/.fastai/ directory, so I'll put this dataset there too. I'll use fastai's download_images function to do the actual downloading.

print(download_images.__doc__)
Download images listed in text file `url_file` to path `dest`, at most `max_pics`

These are the arguments it takes.

Argument Meaning Default
dest Folder Path to save files to None (required)
url_file Text file with one URL per line to use as source None (only used if urls is None)
urls Iterable collection of URLs to download None
max_pics Limit on the number of images to download 1000
n_workers Number of parallel threads to use 8
timeout Seconds to allow for a download 4
preserve_filename Whether to use the filename in the URL False

We'll add two extra keywords - "sun" and "shade" to the search to hopefully get images that match those conditions and between each search query I'll put in a sleep so that we aren't hitting the server too hard. We'll also use fastai's resize_images to make sure that none of the images are too big. The argument max_size gives the maximum number of pixels either dimension (height or width) can have.

def download_and_resize(destination: Path, search_terms: str, max_size: int=400) -> None:
    """Download images and resize them

    Args:
     destination: path to parent folder
     search_terms: keywords to use to search for images
     max_size: maximum size for height and width of images
    """
    download_images(
        dest=destination,
        urls=get_image_urls(SEARCH_TERMS)
    )

    resize_images(path=destination,
                  max_size=max_size,
                  dest=destination)
    return

The path argument is the source of the images and the dest is where you want to put the resized images. Normally I don't suppose you'd want to remove the original images, but in this case I do so they're set to the same folder.

ANIMALS = ("tanuki", "raccoon")

PAUSE = 10
PAUSE_BETWEEN_SEARCHES = partial(sleep, PAUSE)
CONDITIONS = tuple(("", "sun ", "shade "))

print(f"Estimated Run Time: {len(CONDITIONS) * len(ANIMALS) * PAUSE + 15} seconds")

with TIMER:
    print("Searching for:")
    for animal in ANIMALS:
        destination = DATA_PATH/animal
        destination.mkdir(exist_ok=True, parents=True)

        for condition in CONDITIONS:
            SEARCH_TERMS = f"{animal} {condition}"
            print(f" - '{SEARCH_TERMS}'")
            download_and_resize(destination, SEARCH_TERMS)
            PAUSE_BETWEEN_SEARCHES()
Estimated Run Time: 75 seconds
Started: 2022-12-08 18:24:00.371278
Searching for:
 - 'tanuki '
 - 'tanuki sun '
 - 'tanuki shade '
 - 'raccoon '
 - 'raccoon sun '
 - 'raccoon shade '
Ended: 2022-12-08 18:27:07.360951
Elapsed: 0:03:06.989673

Verify the Dataset

Some of the images might be invalid for whatever reason, we'll use a fastai builtin function (verify_images) to check them and Path.unlnk to delete the files that were deemed invalid. verify_images works by trying to open each file as an image. It adds some parallelism to speed it up but isn't doing anything fancy and, depending on how many files you have and their size, might take a little while to cmoplete.

with TIMER:
    failed = verify_images(get_image_files(DATA_PATH))
    failed.map(Path.unlink)
print(f"{len(failed)} images were deemed failures.")
Started: 2022-12-08 18:28:17.277347
Ended: 2022-12-08 18:28:22.806488
Elapsed: 0:00:05.529141
18 images were deemed failures.

Training the Model

loaders = DataBlock(
    blocks=(ImageBlock, CategoryBlock), 
    get_items=get_image_files, 
    splitter=RandomSplitter(valid_pct=0.2, seed=42),
    get_y=parent_label,
    item_tfms=[Resize(192, method='squish')]
).dataloaders(DATA_PATH)
Parameter Argument Description
blocks (ImageBlock, CategoryBlock) Defines the inputs as images and outputs as categories
get_items get_image_files A function to search for image files.
splitter RandomSplitter A class to split the data into training (80%) and validation (20%)
get_y parent_label A function that grabs the name of the folder to use as an image label.
item_tfms Resize Resize all the images to a uniform size (192 x 192) by squishing them.

And now we train the categorizer.

with warnings.catch_warnings() as catcher:
    warnings.simplefilter("ignore")
    learner = vision_learner(loaders, resnet18, metrics=error_rate)

with learner.no_bar() as nobar, Timer() as timmy:
    learner.fine_tune(3)
Started: 2022-12-08 18:28:55.158226
[0, 0.29742079973220825, 0.0608036108314991, 0.020555555820465088, '00:12']
[0, 0.05481018126010895, 0.0367087759077549, 0.009444444440305233, '00:16']
[1, 0.029521549120545387, 0.0178204495459795, 0.004999999888241291, '00:17']
[2, 0.012186083942651749, 0.013458597473800182, 0.006666666828095913, '00:17']
Ended: 2022-12-08 18:29:59.272703
Elapsed: 0:01:04.114477

I put the supression of the warnings in because somebody (I assume FastAI) is calling pytorch with deprecated arguments.

Some Examples

A Helper

def predict_category(path: str, learner) -> tuple:

    with learner.no_bar():
        prediction, probability_index, probabilities = learner.predict(
            PILImage.create(path))
    print(f"This is a {prediction}.")
    print(f"Probability it's a {prediction}: {float(probabilities[int(probability_index)]):.2f}")
    return prediction, probability_index, probabilities

predict = partial(predict_category, learner=learner)

A Tanuki

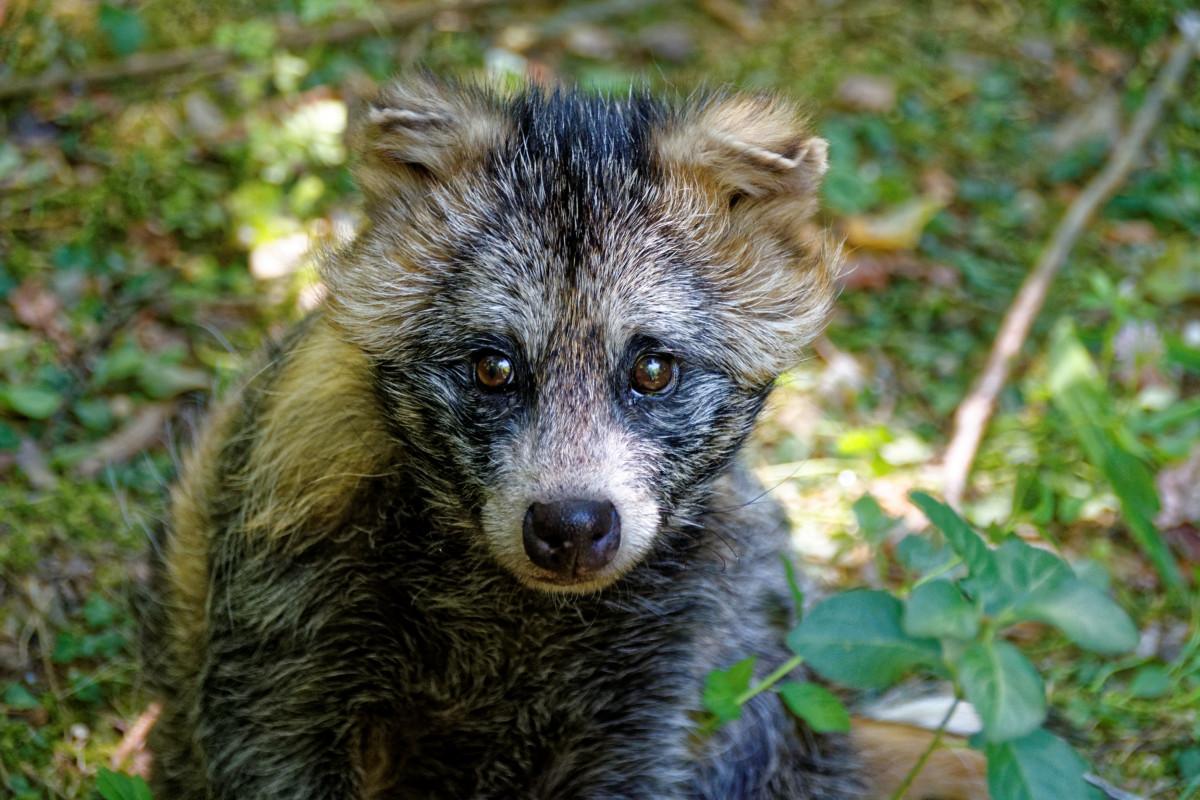
Let's look at the output of the learner.predict method when we pass the model the picture of a raccoon dog that we looked at when we were looking at the duckduckgo search example.

TANUKI_PATH = "/tmp/tanuki_image.jpg"
urlsave(url=TANUKI_URLS[0], dest=TANUKI_PATH)
prediction, probability_index, probabilities = predict(TANUKI_PATH)
This is a raccoon.
Probability it's a raccoon: 0.99

tanuki_image.jpg

Prediction

The prediction returned by learner.predict is a string version of whatever your labeling function (parent_label in this case) returns.

print(prediction)
raccoon

In this case it thinks it's a raccoon, not a raccoon dog, so our model probably isn't ready for prime-time, but let's look at rest of the output anyway.

Probabilities

The probabilities is a TensorBase which, for our purposes, acts like a list of the probabilities that our image belongs to one of the classifications.

print(probabilities)
TensorBase([0.9894, 0.0106])

There are two probabilities because we have two classifications (raccoon and tanuki). When I first encountered fastai one of the things I couldn't figure out is which probability matches which classification. To figure that out you need our next value, the probability_index.

Probability Index

The probability_index tells you which one of the probabilities matches the predicted classification.

print(probability_index)
TensorBase(0)

Our model predicted that the image was a raccon and since the probability index is 0, the "raccoon" category matches the first entry in the probabilities collection, and looking back at the probabilities this means that the model is 99% sure that this is a raccoon.

Now, a Raccoon

RACCOON_PATH = "/tmp/raccoon_image.jpg"
urlsave(url=RACCOON_URLS[0], dest=RACCOON_PATH)
prediction, probability_index, probabilities = predict(RACCOON_PATH)
This is a raccoon.
Probability it's a raccoon: 1.00

raccoon_image.jpg

It's really sure this is a raccoon.

And Then, the End

The final loss for the model during training was pretty low (less than 1%) but it wasn't able to identify our one tanuki test image. On the one hand, less than 1% loss isn't 0 loss, so I might just have chosen one example that is particularly hard. It might also be important that tanuki and raccoons do look quite a bit alike, so this is a harder problem than, say, cats versus dogs. Also, our method for gathering images isn't checking that the images are unique (although the URLs are, they might be redundant postings), and tanuki might be obscure enough that there aren't a huge variety of images out there, making it harder for the model to train to identify them.

FastAI QuickStart Tabular Data

The Beginning

Imports

# python
from functools import partial

# fastai
from fastai.tabular.all import (
    Categorify,
    FillMissing,
    Normalize,
    TabularDataLoaders,
    URLs,
    accuracy,
    tabular_learner,
    untar_data,
)

# pypy
from tabulate import tabulate

import numpy
import pandas

# my stuff
from graeae import Timer
table = partial(tabulate, tablefmt="orgtbl", headers="keys")
TIMER = Timer()

The Middle

The Data

We're using the Adult Data Set, which has an unfortunate title but is a dataset built from 1994 census data to predict whether a person has an income greater than $50,000 a year.

path = untar_data(URLs.ADULT_SAMPLE)
DATA_PATH = path/"adult.csv"
data = pandas.read_csv(DATA_PATH)

numerical = data.select_dtypes(include=[numpy.number])
non_numerical = data.select_dtypes(exclude=[numpy.number])
print(table(numerical.describe()))
  age fnlwgt education-num capital-gain capital-loss hours-per-week
count 32561 32561 32074 32561 32561 32561
mean 38.5816 189778 10.0798 1077.65 87.3038 40.4375
std 13.6404 105550 2.573 7385.29 402.96 12.3474
min 17 12285 1 0 0 1
25% 28 117827 9 0 0 40
50% 37 178356 10 0 0 40
75% 48 237051 12 0 0 45
max 90 1.4847e+06 16 99999 4356 99
print(table(non_numerical.describe()))
  workclass education marital-status occupation relationship race sex native-country salary
count 32561 32561 32561 32049 32561 32561 32561 32561 32561
unique 9 16 7 15 6 5 2 42 2
top Private HS-grad Married-civ-spouse Prof-specialty Husband White Male United-States <50k
freq 22696 10501 14976 4073 13193 27816 21790 29170 24720

The column names don't really make clear what some things are, but since this is a quickstart I'll ignore their meaning but note that it was useful to split the data up by numeric and non-numeric types becaus when you build the TabularDataLoader you should specify the numeric and categorical column names. The fastai example only specifies some of the columns but I'll dump them all in and see what happens.

numeric_columns = numerical.columns.to_list()
categorical_columns = non_numerical.columns.to_list()[:-1]

The Data Loader

The original quickstart uses the TabularDataLoaders class to load batches of data for training, along with some pre-processing classes to encode the categorical data to make it numeric, fill in the missing values, and normalize the values so their ranges will match.

TARGET = "salary"

loader = TabularDataLoaders.from_csv(
    DATA_PATH, path=path, y_names=TARGET,
    cat_names = categorical_columns,
    cont_names = numeric_columns,
    procs = [Categorify, FillMissing, Normalize])

The Learner

learner = tabular_learner(loader, metrics=accuracy)

with learner.no_bar() as nobu, TIMER as tim:
    learner.fit_one_cycle(2)
Started: 2022-11-06 17:09:17.344678
[0, 0.37480291724205017, 0.35229262709617615, 0.8412162065505981, '00:02']
[1, 0.3569386303424835, 0.34605613350868225, 0.8421375751495361, '00:02']
Ended: 2022-11-06 17:09:23.994030
Elapsed: 0:00:06.649352

The Learned

Since the last column salary is the target we'll have to drop it before training the model on the data.

unsalaried = data.drop(["salary"], axis=1)
test_set = learner.dls.test_dl(unsalaried)

row, classifications, probabilities = learner.predict(
    data.iloc[0])

Sources

FastAI Quickstart: Movie Review Sentiment

The Beginning

The top post for the quickstart posts is this one and the previous post was on image segmentation.

Imports

# python
from pathlib import Path

# fastai
from fastai.text.all import (
    accuracy,
    AWD_LSTM,
    TextDataLoaders,
    text_classifier_learner,
    untar_data,
    URLs,
)

# monkey stuff
from graeae import Timer

TIMER = Timer()

The Model

Training the RNN

Note: Using untar_data for this dataset seems to fail with a FileNotFoundError. It's looking for a file ~/.fastai/data/imdb_tok/counter.pkl that isn't there. It seems to be something that other people have encountered as well (on the fastai forums, on github). This might need to be downloaded the old-fashioned way instead.

Update: untar_data seems to successfully download the imdb data but then something goes wrong with the imdb_tok folder. If you just delete it and pass in the path to the imdb folder (e.g. ~/.fastai/data/imdb/) to the data loader it seems to work.

path = untar_data(URLs.IMDB)

So here's the bit where we have to work around the untar_data error and pass in the path to the downloaded folder to the TextDataLoaders (why is this plural?).

Note: On the machine that I'm using the defaults for the transfer learning causes a CUDA Out of Memory Error. Following the advice in this github ticket I reduced the batch size to get it to work (the default is 64, 32 still crashed so I went for 16) so it takes a fairly long time to finish.

path = Path("~/.fastai/data/imdb/").expanduser()
BATCH_SIZE = 16

loader = TextDataLoaders.from_folder(path , valid='test', bs=BATCH_SIZE)
learner = text_classifier_learner(loader, AWD_LSTM, drop_mult=0.5, metrics=accuracy)
with learner.no_bar() as no_bar, TIMER as t:
    learner.fine_tune(2, 1e-2)
Started: 2022-11-03 18:19:52.039717
[0, 0.5076004862785339, 0.4184568226337433, 0.8115599751472473, '09:36']
[0, 0.2924654185771942, 0.21511425077915192, 0.9154800176620483, '14:35']
[1, 0.22890949249267578, 0.19540540874004364, 0.9239199757575989, '14:35']
Ended: 2022-11-03 18:58:39.453115
Elapsed: 0:38:47.413398

Testing it Out

with learner.no_bar():
    print(learner.predict("I really like this movie.")[2][1])
    print(learner.predict("I like this movie.")[2][1])
    print(learner.predict("I didn't like this movie.")[2][1])
    print(learner.predict("I hated this movie.")[2][1])
    print(learner.predict("I really hated this movie.")[2][1])
tensor(0.4845)
tensor(0.8964)
tensor(0.5823)
tensor(0.0839)
tensor(0.1197)

It appears to not think "really hated" is more positive than "hated", but more or less follows what you'd expect. But is this a general sentiment analyzer or only a movie sentiment analyzer?

with learner.no_bar():
    print(learner.predict("I really like this book.")[2][1])
    print(learner.predict("I like this car.")[2][1])
    print(learner.predict("I didn't like this lettuce.")[2][1])
    print(learner.predict("I hated this weather.")[2][1])
    print(learner.predict("I really hated this meeting.")[2][1])
tensor(0.9321)
tensor(0.7614)
tensor(0.2984)
tensor(0.0582)
tensor(0.3288)

It seems to pretty much follow the same pattern, although it was even more confused by really hating meetings.

with learner.no_bar():
    print(learner.predict("This lettuce is great.")[2][1])
    print(learner.predict("This lettuce is like butter.")[2][1])
    print(learner.predict("This lettuce was good enough.")[2][1])
    print(learner.predict("The lettuce was okay.")[2][1])
    print(learner.predict("I thought this lettuce wasn't very good.")[2][1])
    print(learner.predict("This lettuce is terrible.")[2][1])
    print(learner.predict("This lettuce was worse than spam.")[2][1])
tensor(0.9444)
tensor(0.2520)
tensor(0.6674)
tensor(0.3201)
tensor(0.4201)
tensor(0.0237)
tensor(0.0191)

End

I think as long as you pass in adjectives that it encountered in the reviews it works well enough. In a way it's more interesting to see how terms match up relative to each other (e.g. terrible isn't as bad as hated and okay is worse than wasn't very good) as it gives you a sense of how the reviewers use descriptive words in their reviews.

FastAI Quickstart: Segmentation

Beginning

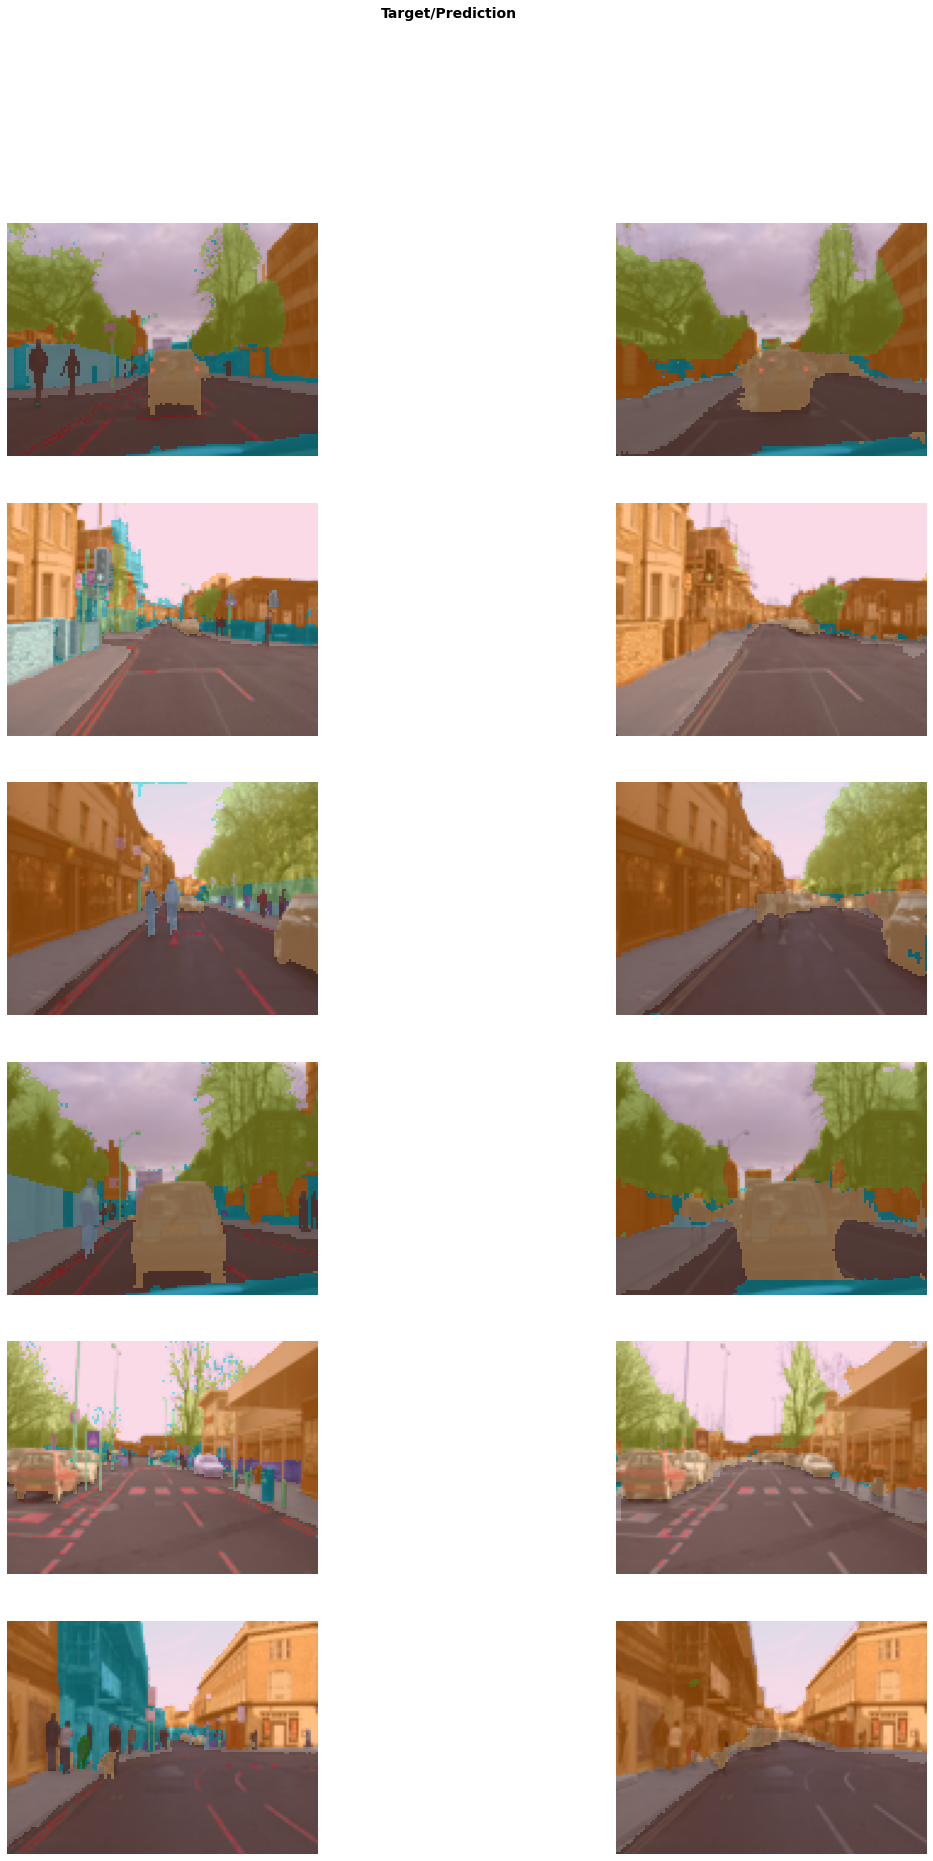
This is a look at the part of the fastai Quick Start that demonstrates image segmentation (Wikipedia Article). The goal here is to break images up into sub-parts.

The top post for the quickstart posts is this one and the previous post was the cat image identifier.

Imports

from fastai.vision.all import (
    SegmentationDataLoaders,
    SegmentationInterpretation,
    URLs,
    get_image_files,
    resnet34,
    unet_learner,
    untar_data,
    )

import numpy

Middle

Data, Model, Training

The dataset is a subset of the Cambridge-Driving Labeled Video Database (CamVid).

path = untar_data(URLs.CAMVID_TINY)
loader = SegmentationDataLoaders.from_label_func(
    path, bs=8, fnames=get_image_files(path/"images"),
    label_func = lambda o: path/'labels'/f'{o.stem}_P{o.suffix}',
    codes = numpy.loadtxt(path/'codes.txt', dtype=str)
)

learner = unet_learner(loader, resnet34)
with learner.no_bar():
    learner.fine_tune(8)
[0, 3.394050359725952, 2.541146755218506, '00:01']
[0, 1.87003755569458, 1.5329511165618896, '00:01']
[1, 1.567323088645935, 1.4149396419525146, '00:01']
[2, 1.3944206237792969, 1.1255743503570557, '00:01']
[3, 1.2387481927871704, 0.8764406442642212, '00:01']
[4, 1.1080732345581055, 0.8167174458503723, '00:01']
[5, 1.0044615268707275, 0.77195143699646, '00:01']
[6, 0.91986483335495, 0.7509599924087524, '00:01']
[7, 0.8545125722885132, 0.7430445551872253, '00:01']


Column Label
0 epoch
1 train_loss
2 valid_loss
3 error_rate
4 time


with learner.no_bar():
    learner.show_results(max_n=6, figsize=(20, 30))

segmentation-example.png

Note: The example ends with a plot of the images that had the greatest loss, but out of the box it doesn't work in this org-mode setup so I'll skip it for now, since I think it will be a bit of a slog figuring out how to get it working.

End

The top post for the quickstart posts is this one and the next post will be on sentiment analysis.

FastAI Cats and Dogs

What Is This?

This is a run-through of the fastai Computer Vision Quickstart that shows how to build an image classification model from a public dataset hosted on fastai's site. It is similar to the post on classifying rabbits and pigs except in the other post we create our own dataset by searching duckduckgo for images.

Importing

# python standard library
from pathlib import Path

As noted on Stack Overflow, FastAI does a lot of monkey patching, so if you just import something from where it's defined (to make it clearer where things are coming from) it might not have the methods or attributes you expect. In this case, for instance, the vision_learner function is defined in fastai.vision.learner but if you try and import it from there the object you get back won't have the to_fp16 method that we're going to use so you have to import it from fastai.vision.all instead. Since there's no good way to avoid using all I'll import objects from there but I'll try and also point to the original modules where things are defined to make it easier to look things up.

Module Import
fastai.data.external untar_data, URLs
fastai.data.transforms get_image_files
fastai.metrics error_rate
fastai.vision.augment Resize
fastai.vision.core PILImage
fastai.vision.data ImageDataLoaders
fastai.vision.learner vision_learner
torchvision.models.resnet resnet34


from fastai.vision.all import (
    ImageDataLoaders,
    PILImage,
    Resize, 
    URLs,
    error_rate,
    get_image_files,
    resnet34,
    untar_data,
    vision_learner,
)

Setting Up

This downloads the Oxford-IIIT Pet Dataset. Despite the name, there are only cats and dogs in the dataset (37 breeds across the species).

Function/Object Description Documentation Link
untar_data Function to download fastai datasets/weights External Data, function arguments
URLs Constants for datasets A brief description

By default this will download the data to ~/.fastai/data but both untar_data and URLs (note the s at the end is lowercase) take an argument c_key that allows changing this but I don't know what the difference is between using one or the other.

path = untar_data(URLs.PETS)/"images"
print(path)
/home/athena/.fastai/data/oxford-iiit-pet/images

The names of the files give the breed of the pet (either cat or dog) with dog names all in lower case (e.g. "yorkshire_terrire_9.jpg") and cats with the first initials capitalized (e.g. "Abyssinian_100.jpg"). So our function to categorize the training data will check if the first letter is a capital letter and label it True if it is, False if it isn't, using the following function.

def its_a_cat(filename: str) -> bool:
    """Decide if file is a picture of a cat

    Args:
     filename: name of file where first letter is capitalized if it's a cat

    Returns:
     True if first letter is capitalized (so it's a picture of a cat)
    """
    return filename[0].isupper()

This next bit creates a batch data loader for us.

Object Description Documentation
ImageDataLoaders Data loader with functions for images. ImageDataLoaders, from_name_func
get_image_files Recursively retrieve images from folders. docstring
Resize Resize each image (if you pass in one size it uses it for all dimensions). docstring


loader = ImageDataLoaders.from_name_func(
    path,
    get_image_files(path),
    valid_pct=0.2,
    seed=42,
    label_func=its_a_cat,
    item_tfms=Resize(224)
)

Now we create the model that learns to detect cats.

Object Description Documentation
vision_learner Builds a model for transfer learning. Arguments
resnet34 Residual Network model torchvision documentation
error_rate 1 - accuracy (the fraction that was incorrect) arguments
to_fp16 Use 16-bit (half-precision) floats Mixed Precision Training Explained


learner = vision_learner(
    loader, resnet34, metrics=error_rate)

cat_model = learner.to_fp16()

Pretty much all of this is inexplicable if you haven't used some kind of neural network library before, but that last call (``to_fp16``) seems especially mysterious. This first part is just about making sure things work, though, so I'll wait until I get to the more detailed explanations to figure it out, although their article "Mixed Precision Training Explained" explains it pretty well.

Train It

We're using a pre-trained model so we just have to do some transfer learning - freezing the weights of most of the layers and training the last layer to make a cat or not a cat classification.

For some reason fastai assumes that you'll only run it in a jupyter notebook and dumps out a progress bar with no simple way to disable it permanently. As a workaround I'll use the context-manager no_bar to turn off the progress bar temporarily.

Method Description Documentation
fine_tune Does transfer learning (presumably) None found, but here's the signatures for the freeze and unfreeze methods
no_bar Turn off the progress bar. docstring


with cat_model.no_bar():
    cat_model.fine_tune(1)
[0, 0.17085878551006317, 0.019044965505599976, 0.005412719678133726, '00:20']
[0, 0.05584857985377312, 0.01942548155784607, 0.0067658997140824795, '00:25']

Fastai really seems to want to force you to use their system the way they do - the output from fine_tune is printed to standard out and not returned as some kind of object so I can't re-format it to make it nicer looking here (using org-mode), but for reference, the columns for the two rows of output are:

  • epoch
  • train_loss
  • valid_loss
  • error_rate
  • time

Given these labels, the output of the last block shows that the error rate for the second epoch was 0.005, and it took about twenty and twenty-five seconds per epoch.

Some Test Images

We're going to apply our model to some images of cats and a dog to see what it tells us about the image. Since it's the same process for each image I'll create a function check_image to handle it.

Object Description Documentation
PILImage Object to represent images. docstring
create Load the image as PILImage load_image, PILBase (follow source link to see definition of create)


def check_image(path: str) -> None:
    """Loads the image and checks if it's a cat

    Args:
     path: string with path to the image
    """
    POSITIVE, NEGATIVE = " think", " don't think"

    image = PILImage.create(Path(path).expanduser())

    with cat_model.no_bar():
        ees_cat, _, probablilities = cat_model.predict(image)
    print(f"I{POSITIVE if ees_cat=='True' else NEGATIVE} this is a cat.")
    print(f"The probability that it's a cat is {probablilities[1].item():.2f}")
    return

A Cat

Here's our first test image.

test-cat.jpg

As you can see, it appears to be ridden with parasites, causing it to scratch uncontrollably (the toxoplasma isn't visible but assumed) -let's see how our classifier does at guessing that it's a cat.

check_image("~/test-cat.jpg")
I think this is a cat.
The probability that it's a cat is 1.00

So, it's pretty sure that this is a cat.

A Negative Test Image

We could try any image, but for now, since the dataset used dogs and cats, let's see if it thinks a dog is a cat.

test-dog.jpg

check_image("~/test-dog.jpg")
I don't think this is a cat.
The probability that it's a cat is 0.00

It's sure that this isn't a cat.

A Strange Cat

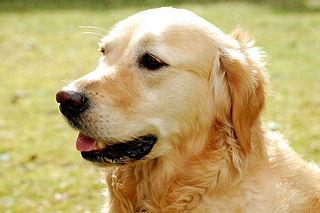
I tried to find images of cats that looked like dogs or vice-versa, but it turns out that they're pretty different looking things, so let's just try an unusual looking cat.

elf-cat.jpg

check_image("~/elf-cat.jpg")
I think this is a cat.
The probability that it's a cat is 1.00

The End

So there you go, not really exciting, which I suppose is sort of the point of fastai - it should be simple, almost boring, to do image classification. This is just a rehash of what they did, of course, a better check would be to try something different, but since this is the first take it'll have to do for now.

The top post for the quickstart posts is this one and the next post will be on Image Segmentation.

Sources

Fast AI

Test Images (Wikimedia commons)