How Do Neurons Work?
Table of Contents
- Beginning
- Middle
- What is the simplest neural network we can create to make this prediction?
- What does knowledge and information mean in our neural network?
- What kind of memory does a neuron have?
- So weights are memory, but what is it memorizing?
- So, how do you handle multiple inputs?
- How would you do this with numpy?
- End
Beginning
Imports
Some if this is needed to draw the network so I'm putting all the imports first.
From Python
 from functools import partial
 from pathlib import Path
 from typing import List
From PyPi
from graphviz import Digraph
import holoviews
import hvplot.pandas
import numpy
import pandas
import torch
Others
from graeae import EmbedHoloviews
What is this about?
These are notes on Chapter Three of "Grokking Deep Learning". It is an explanation of how neural networks perform the first step of training the model - making predictions - illustrated with a single neuron. Predicting might seem like a step for after you finish training the model, but in order to correct the model you have to first make predictions to see how well it is doing. We'll look at a model that predicts whether a team will win a game based on a single feature (the average number of toes on the team).
Heres' the network.
SLUG = "how-do-neural-networks-work/"
PATH = Path("../../../files/posts/grokking/03_forward_propagation/")/SLUG
graph = Digraph(comment="Toes Model", format="png",
                graph_attr={"rankdir": "LR", "dpi": "200"})
graph.node("A", "Toes")
graph.node("B", "Win")
graph.edge("A", "B", label="w=0.1")
graph.render(PATH/"toes_model_1.dot")
graph
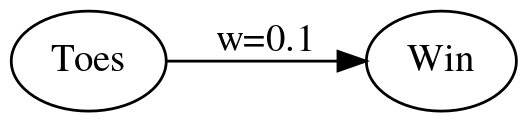
Although we're calling it a network we're really creating only the first building block for a single neuron. A neuron works by doing three basic things:
- It receives signals from other neurons (over dendrites, the inputs to the neuron)
- It aggregates the signals within the cell-body (soma) of the neuron
- If the cell voltage crosses a threshold then it fires a signal out across its axon
We can kind of say there's an implied axon to our network, it just isn't shown, and we can read the Toes node as either another neuron and the edge between it and the Win node is a synapse (Greek for conjunction) which contains an axon coming out of Toes that joins the dendrite going into Win), giving us a network of two nodes, but what we are missing is the test to see if the cell's charge exceeds a threshold. That will come later.
Set Up
Plotting
Embed = partial(
    EmbedHoloviews,
    folder_path=PATH)

holoviews.opts(width=1000, height=800)
Types
This is for type-hinting.
Numbers = List[float]
Middle
What is the simplest neural network we can create to make this prediction?
Our Network
Our network represents two neurons with a synapse between them. The dendrite leading into the Win neuron has a certain weight representing how much of the input signal (average number of toes) can get across it to the Win neuron - the higher the weight, the more signal it contributes to our Win neuron deciding whether to fire or not (once we add a threshold). In this case we have an arbitrary weight of 0.1. The input to the Win neuron is just the weight of the dendrite times the output of the Toes neuron.
In the book Grokking Deep Learning Andrew Trask uses the analogy of the weights being like the knob on a machine that turns the volume up and down (I don't think he says volume, but it's the same idea). This is something that I seem to recall seeing in books describing the coefficients for linear regression - every variable you add gives you another knob to tune, but since the more common analogy is to think of modeling artificial neurons in the brain, it might be better to think of the weights as the thickness of the dendrite.
 def one_neuron(toes: float, weight: float=0.1) -> float:
     """This is a model to predict whether a team will win

     Args:
      toes: Average number of toes on the team
      weight: how much to weight to give to the toes

     Returns:
      prediction: our guess as to the probability that they will win
     """
     return toes * weight
Some Predictions
We can test out what our model thinks with some test values.
 average_toes = [8.5, 9, 9.5, 10]
 predictions = [one_neuron(toe) for toe in average_toes]
 print("| Toes | Probability of Winning (%)|")
 print("|-+-|")
 for index, toes in enumerate(average_toes):
     prediction = predictions[index] * 100
     print(f"| {toes} | {prediction:.0f} % |")
| Toes | Probability of Winning (%) |
|---|---|
| 8.5 | 85 % |
| 9 | 90 % |
| 9.5 | 95 % |
| 10 | 100 % |
 data = pandas.DataFrame({"Average Toes": average_toes,
                          "Probability of Winning": predictions})
 plot = data.hvplot(x="Average Toes", y="Probability of Winning").opts(
     width=1000, height=800, title="Toe Model")
 Embed(plot=plot, file_name="toes_only_predictions")()
As you can see, it's just a straight line. If we think in terms of the familiar \(y=mx + b\), our model is the equivalent of:
\[ probability = 0.1 \times toes \]
Where \(b=0\). So every toe contributes 10% to our prediction.
What does knowledge and information mean in our neural network?
The neural network stores its knowledge as weights and when given information (input) it converts them to a prediction (output).
What kind of memory does a neuron have?
A neuron stores what its learned (long-term memory) as the weight on the edge(s). The neuron as we've implemented it doesn't have any short-term memory, it can only consider one input at a time and "forgets" the previous input that it got. To have short-term memory you need to employ a different method that uses multiple inputs at the same time.
So weights are memory, but what is it memorizing?
Since the neuron represents one feature (average toes) the weight is how important this feature is to the outcome (winning). If you have multiple features, the weights turn up or down the volume for each of the features (thus the knob analogy).
So, how do you handle multiple inputs?
If you have multiple inputs then your prediction is the sum of the individual inputs times their weights.
 graph = Digraph(comment="Three Nodes", format="png",
                 graph_attr={"rankdir": "LR", "dpi": "200"})
 graph.node("A", "Toes")
 graph.node("B", "Wins")
 graph.node("C", "Fans")
 graph.node("D", "Prediction")
 graph.edge("A", "D", label="0.1")
 graph.edge("B", "D", label="0.2")
 graph.edge("C", "D", label="0.0")
 graph.render(PATH/"three_nodes.dot")
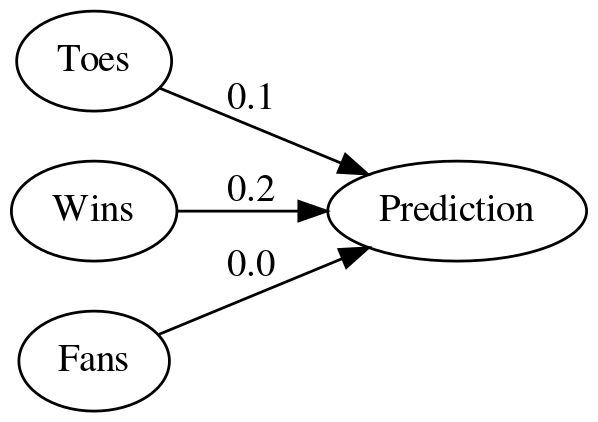
Here we've added two more input neurons - Wins is the fraction of games played that the team won and Fans is the number of fans the team has (in millions).
Weighted Sum
Since we have three nodes we need to return the sum of the weights and inputs. If we think of the weights and inputs as vectorns then this is their dot-product.
 def weighted_sum(inputs: Numbers, weights: Numbers) -> float:
     """calculates the sum of the products

     Args:
      inputs: list of input data
      weights: list of weights for the inputs

     Returns:
      sum: the sum of the product of the weights and inputs
     """
     assert len(inputs) == len(weights)
     return sum((inputs[item] * weights[item] for item in range(len(inputs))))
The Node
Right now this next function is just an alias for the weighted_sum but eventually we'll be doing more with it.
 def network(inputs: Numbers, weights:Numbers) -> float:
     """Makes a prediction based on the inputs and weights"""
     return weighted_sum(inputs, weights)
Some Inputs
We have some data collected about our team over four games.
| Variable | Description |
|---|---|
toes |
average number of toes the members have at game-time |
record |
fraction of games won |
fans |
Millions of fans that watched |
 toes = [8.5, 9.5, 9.9, 9.0]
 record = [0.65, 0.8, 0.8, 0.9]
 fans = [1.2, 1.3, 0.5, 1.0]
Each entry in the vectors is the value that was true just before each game. This makes the first record entry sort of non-sensical, but it's just an illustration.
weights = [0.1, 0.2, 0.0]
The weights correspond to (toes, record, fans) for each game so we weight the win-loss record the most and fans not at all. Our for game i (so 0 if it's the first game), our prediction will be calculated as:
\begin{align} prediction_i &= toes_i \times weights_0 + record_i \times weights_1 + fans_i \times weights_2\\ &= (0.1) toes_i + (0.2) record_i + (0) fans_i\\ \end{align}print("|Game|Prediction|")
print("|-+-|")
predictions = [
network([toes[game], record[game], fans[game]], weights)
for game in range(len(toes))]
assert abs(predictions[0] - 0.98) < 0.1**5
for game, prediction in enumerate(predictions):
print(f"|{game + 1}|{prediction:.2f}")
| Game | Prediction |
|---|---|
| 1 | 0.98 |
| 2 | 1.11 |
| 3 | 1.15 |
| 4 | 1.08 |
With the exception of game one we're predicting that the combination of toes and previous wins make the win pretty much inevitable. We should also note that the highestt prediction went to the third game which was the game with the highest number of average toes. Even though we weighted the win-loss record higher, the values being passed in are much greater for the toes than for the win-loss record.
 data = pandas.DataFrame({"toes": toes, "record": record,
                          "prediction": predictions})
 data = data.sort_values(by="toes")
 prediction_plot = data.hvplot(x="toes", y="prediction")
 other = data.hvplot(x="toes", y="record")
 plot = (prediction_plot * other).opts(
     title="Toes vs Record & Prediction",
     width=1000,
     height=800,
 )

 Embed(plot=plot, file_name="toes_vs_record")()
Looking at the plot you can see that the probability keeps climbing with the number of toes and the peak record (9 toes, 90% wins) is canceled out by the fact that it occurs with a team with fewer toes than the peak of 9.9 toes.
How would you do this with numpy?
Although we used for-loops to calculate the predictions, we can view each of the inputs as a vector and the weights as a vector and then the prediction becomes the dot product of the inputs and the weights, so we can use numpy's dot method to calculate it for us.
 print("|Game|Prediction|")
 print("|-+-|")

 network = numpy.array([toes, record, fans])
 predictions = network.T.dot(weights)
 assert abs(predictions[0] - 0.98) < 0.1**5

 for game, prediction in enumerate(predictions):
     print(f"|{game + 1}|{prediction:.2f}|")
| Game | Prediction |
|---|---|
| 1 | 0.98 |
| 2 | 1.11 |
| 3 | 1.15 |
| 4 | 1.08 |
What about pytorch
Pytorch can act like numpy working on the GPU, making the calculations faster, but the syntax is a little different (and it uses matmul instead of dot).
print("|Game|Prediction|")
print("|-+-|")

device = torch.device("cuda") if torch.cuda.is_available() else torch.device("cpu")
inputs = torch.tensor([toes, record, fans], device=device)
weights_vector = torch.tensor(weights, device=device)
predictions = inputs.T.matmul(weights_vector).tolist()
for game, prediction in enumerate(predictions):
    print(f"|{game + 1}|{prediction:.2f}|")
| Game | Prediction |
|---|---|
| 1 | 0.98 |
| 2 | 1.11 |
| 3 | 1.15 |
| 4 | 1.08 |
Note: In this simple case the pytorch version can be much slower than the numpy version - sometimes "optimization" isn't really optimal.
End
The main takeaway from this is that a neuron is takes the weighted sum of its input in order to build its internal value (its charge) and the weighted sum is in turn the dot product of the weight vector and the input vector.
Sources
- [GDL] Trask AW. Grokking Deep Learning. Shelter Island: Manning; 2019. 309 p.
- [DLI] Krohn J. Deep Learning Illustrated: a visual, interactive guide to artificial intelligence. Boston, MA: Addison-Wesley; 2019.
- iamtrask: Andrew Trask's jupyter notebook (on github) for this chapter