Custom Filters
Table of Contents
Introduction
This is from Udacity's Deep Learning Repository which supports their Deep Learning Nanodegree.
Set Up
Imports
From PyPi
from dotenv import load_dotenv
import matplotlib.pyplot as pyplot
import matplotlib.image as mpimg
import cv2
import numpy
import seaborn
This Project
from neurotic.tangles.data_paths import DataPathTwo
Set Up
get_ipython().run_line_magic('matplotlib', 'inline')
seaborn.set(style="whitegrid",
            rc={"axes.grid": False,
                "font.family": ["sans-serif"],
                "font.sans-serif": ["Latin Modern Sans", "Lato"],
                "figure.figsize": (14, 12)},
            font_scale=3)
Read in the image
load_dotenv()
path = DataPathTwo("curved_lane.jpg", folder_key="CNN")
print(path.from_folder)
assert path.from_folder.is_file()
/home/hades/datasets/cnn/curved_lane.jpg
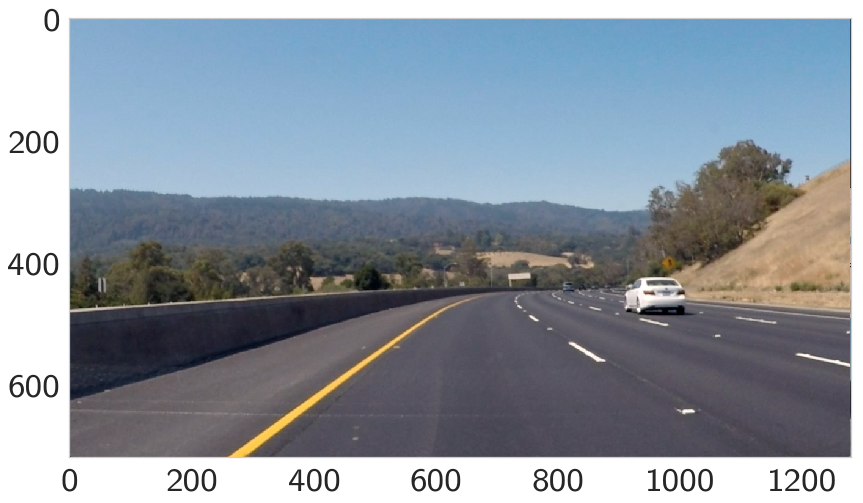
image = mpimg.imread(path.from_folder)

axe_image = pyplot.imshow(image)
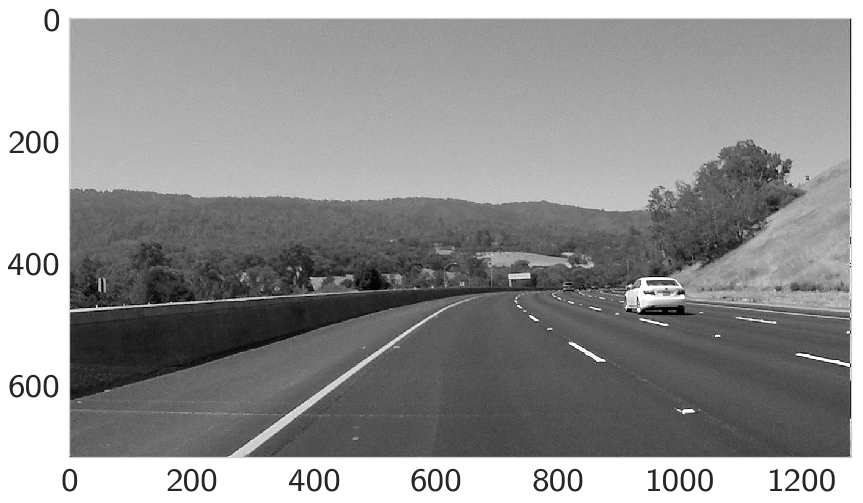
Convert the image to grayscale
gray = cv2.cvtColor(image, cv2.COLOR_RGB2GRAY)
axe_image = pyplot.imshow(gray, cmap='gray')

Create a custom kernel
Below, you've been given one common type of edge detection filter: a Sobel operator.
The Sobel filter is very commonly used in edge detection and in finding patterns in intensity in an image. Applying a Sobel filter to an image is a way of taking (an approximation) of the derivative of the image in the x or y direction, separately. The operators look as follows.

For a challenge, see if you can put the image through a series of filters: first one that blurs the image (takes an average of pixels), and then one that detects the edges.
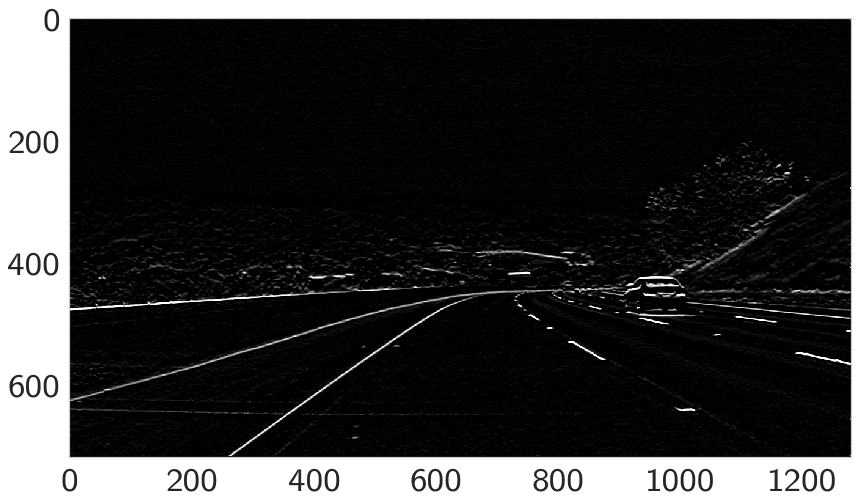
3x3 array for edge detection
sobel_y = numpy.array([[ -1, -2, -1],
                       [  0, 0, 0],
                       [ 1, 2, 1]])
filtered_image = cv2.filter2D(gray, -1, sobel_y)

axe_image = pyplot.imshow(filtered_image, cmap='gray')
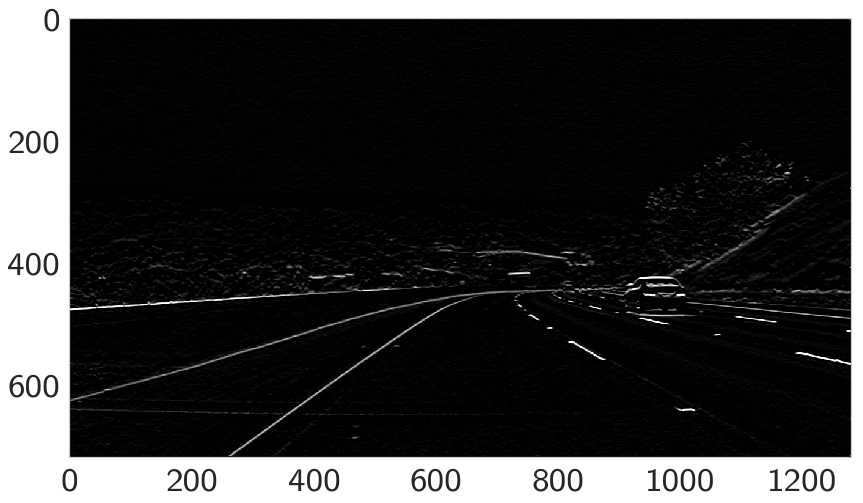
Prewitt
This matrix is from this blog post.
prewitt = numpy.array([[-1, -1, -1],
                       [0, 0, 0],
                       [1, 1, 1]])
filtered_prewitt = cv2.filter2D(gray, -1, prewitt)

axe_image = pyplot.imshow(filtered_prewitt, cmap='gray')
Sharpen
This is from the Wikipedia article about kernels for image processing.
mask = numpy.array([[0, -1, 0],
                    [-1, 5, -1],
                    [0, -1, 0]])
sharpened = cv2.filter2D(gray, -1, mask)

axe_image = pyplot.imshow(sharpened, cmap='gray')
This one isn't so obvious, but if you compare it to the original grayscale image you'll see that it is a little less blurry.